

In this article, you’ll learn how technical analysis works, why even strong candlestick patterns, moving averages, and breakouts can fail, and why risk management and position sizing matter more than trying to predict every move correctly. We’ll also look at real Paper Trading Journal case studies and review key concepts from John J. Murphy’s Technical Analysis of the Financial Markets: A Comprehensive Guide to Trading Methods and Applications.

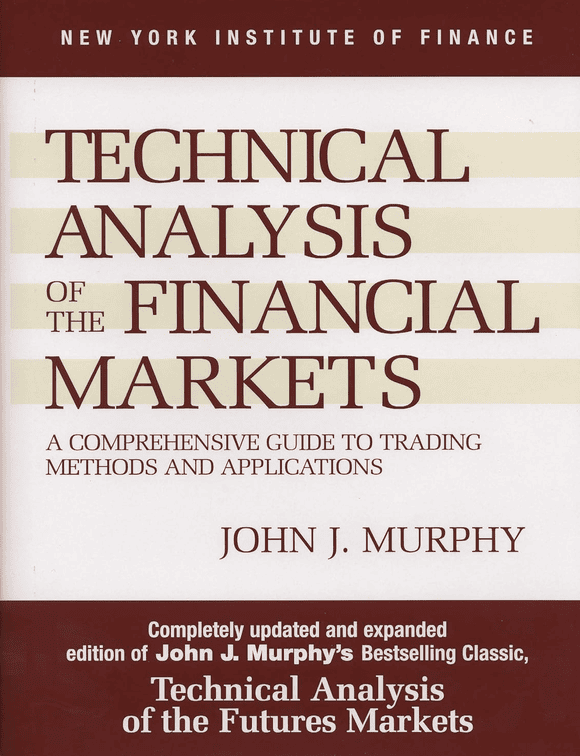
Learn the Fundamentals of Technical Analysis
John J. Murphy’s Technical Analysis of the Financial Markets covers charts, trends, indicators, candlesticks, intermarket relationships, and other core technical analysis concepts.
Price: $34.27–$35.50
View on Amazon →Trading might just be more popular than ever. And one of the first things new day traders learn is technical analysis, which includes understanding candlesticks, moving averages, support and resistance, breakouts, volume, and momentum.
But Warren Buffett famously dismissed the practice of technical analysis with the remark:
“I realized that technical analysis didn’t work when I turned the chart upside down and didn’t get a different answer.”
Although many traders disagree, there is a valid reason to be skeptical of charts on their own… A stock can show a clean breakout, rising volume, bullish candlesticks, aligned moving averages, and strong momentum — then completely reverse.

That does not mean technical analysis is useless. It means technical analysis deals in probabilities, not certainty.
Think about it like this:
Even a setup that works 70% of the time still fails roughly 3 out of every 10 trades.
Charts can help identify opportunities and structure trades. Risk management is what protects you when those setups fail.
In this article, we’ll look at how technical analysis works, why strong-looking setups can fail, and real PTJ case studies where apparent momentum quickly reversed.
The bottom line is that no matter how good the chart looks, you still have to prepare for the possibility that you’re wrong.
Quick Answer: Is Technical Analysis a Sham?
No, technical analysis is not a sham, but it is often misunderstood and overstated. Charts, candlesticks, moving averages, volume, momentum, support, and resistance can help traders evaluate potential setups, but none can predict the next move with certainty. In fact, a trader can be profitable with a win rate below 50% if winning trades are large enough relative to losses. For example, winning 4 out of 10 trades with an average gain of +10% and limiting the other six to -5% would still produce a positive overall result before fees and other costs. That is why technical analysis should be viewed as a tool for identifying probabilities, while risk management determines whether those probabilities ultimately translate into profits or losses.
Learn the Fundamentals of Technical Analysis
John J. Murphy’s Technical Analysis of the Financial Markets covers charts, trends, indicators, candlesticks, intermarket relationships, and other core technical analysis concepts.
Price: $34.27–$35.50
View on Amazon →Understanding Technical Analysis
Technical analysis studies historical price and volume behaviour to identify patterns, trends, momentum and potential areas where market participants could react.
But it’s NOT just a single area of study.
As we’ll explore below, technical analysis consists of reading price charts and understanding candlesticks, as well as looking different types of moving averages to better understand price behavior, breakouts, momentum and potential reversals.
Price Charts & Candlesticks
Candlestick charts are one of the most recognizable tools in technical analysis because they compress a surprising amount of information into a single, easy-to-understand visual.
Each candlestick represents four key prices: the open, high, low, and close, commonly referred to as OHLC data.
The candle’s body shows the relationship between the opening and closing price, while the upper and lower wicks show how far price moved during that period.
A bullish candle forms when the closing price is above the opening price, while a bearish candle forms when the close finishes below the open.
What Does OHLC Mean?
O — Open: The price at the start of the period.
H — High: The highest price reached.
L — Low: The lowest price reached.
C — Close: The price at the end of the period.
Traders then combine individual candles into recognizable patterns such as hammers, dojis, engulfing patterns, shooting stars, and morning or evening stars.
Charts can also help traders identify broader structures such as support and resistance levels, trendlines, channels, and previous highs or lows. These areas can be useful when planning potential entries, exits, and invalidation points.
The problem is that candlesticks describe what market participants have already done, not what they are guaranteed to do next.
A bullish engulfing candle does not cause a stock to rise. A hammer does not guarantee that a bottom has formed. Even a clean breakout above resistance does not require buyers to continue pushing the stock higher.
A chart may show that buyers controlled the previous 5 minutes, 1 hour, or trading session, but the next candle represents an entirely new battle between buyers and sellers.
That distinction is critical.
Candlestick patterns can provide context and help traders identify probabilities, but they cannot turn historical price action into certainty about the future.
Candlesticks Show What Happened — Not What Happens Next
Moving Averages
Moving averages are another foundational tool in technical analysis. They help smooth out short-term price fluctuations so traders can more easily identify the underlying direction of a trend.
A simple moving average (SMA) calculates the average closing price over a set number of periods, while an exponential moving average (EMA) gives greater weight to more recent prices.
Because of that weighting, EMAs generally react more quickly when price begins to move.
SMA vs. EMA
Simple Moving Average (SMA)
Gives equal weight to every price in the selected period.
Exponential Moving Average (EMA)
Gives more weight to recent prices, allowing it to react faster to new price movement.
Traders often compare short-term and long-term moving averages to judge momentum and trend strength.
For example, a stock trading above its 20-day, 50-day, and 200-day moving averages may appear to be in a strong uptrend. Moving average crossovers, such as a shorter moving average rising above a longer one, are also commonly interpreted as bullish signals.
Moving averages can also act as dynamic support or resistance. Traders may watch to see whether price repeatedly bounces from an EMA during an uptrend or struggles to break above one during a downtrend.
However, just like price action and candlesticks, moving averages have an important limitation:
They are calculated entirely from historical prices.
Even a chart with perfectly aligned moving averages, does not guarantee that the trend will continue.
A sudden catalyst, loss of momentum, broader market reversal, or shift in buying and selling pressure can quickly invalidate what previously looked like a textbook trend.
At Paper Trading Journal, we frequently use short-term EMAs when studying post-earnings price action, but we treat them as one piece of the setup rather than a standalone prediction tool.
Moving averages can help confirm what a trend has been doing. They cannot guarantee what that trend will do next.
Perfect EMA Alignment Still Isn’t a Guarantee
Breakouts & Momentum
Breakouts and momentum are central to many technical trading strategies, including the post-earnings momentum approach we study at Paper Trading Journal.

The basic idea is straightforward:
When a stock pushes through resistance, breaks above a recent trading range, or clears key levels across multiple timeframes, traders may interpret that move as evidence that buying pressure is strengthening. The same logic applies in reverse when price breaks below support.
Traders often look for confirmation through high relative volume, large momentum candles, expanding price ranges, and multi-timeframe breakouts.
These are the same kinds of characteristics we examine when studying post-earnings moves, where a strong catalyst can suddenly produce unusually aggressive price action.
A breakout can look especially convincing, such as when price breaks above resistance, trades several times its normal volume, prints consecutive bullish candles, and continues pushing toward new highs.

But none of those signals guarantee continuation.
A stock can break resistance, attract momentum traders, trade enormous volume, and then suddenly reverse back below the breakout level. The breakout itself was real.
What failed was the assumption that buying pressure would continue afterward.
This is one of the biggest lessons from our post-earnings research:
Strong momentum can identify an opportunity, but it cannot tell us with certainty how long that momentum will last. Which is precisely where technical analysis becomes dangerous… when the signals it produces become confused with prediction or certainty.
Technical Analysis of the Financial Markets by John J. Murphy
John J. Murphy’s Technical Analysis of the Financial Markets is one of the better-known reference books for traders who want a broad foundation in chart-based analysis.
The book covers price charts, trend analysis, support and resistance, moving averages, technical indicators, candlestick patterns, intermarket relationships, stocks, stock rotation, and futures markets.
While it’s very true that technical analysis is NOT a crystal ball, in my opinion, what makes the book useful is its scope.
Rather than focusing on a single indicator or trading setup, Murphy explains how different technical tools fit together and how traders use them to interpret market behavior.
That does not mean every signal in the book should ever be treated as a prediction. In fact, that is exactly the point of this article… technical analysis will never 100% accurately predict where price goes next.
But if you ask me, learning technical analysis is still valuable even when no indicator can guarantee the next move.
Understanding these concepts can help traders recognize what other market participants may be watching, identify potential setups, and define levels where a trading thesis may no longer make sense.
For anyone who wants a deeper understanding of the language and structure of technical analysis, Technical Analysis of the Financial Markets remains a strong starting point.
Learn the Language of Technical Analysis
Technical Analysis of the Financial Markets by John J. Murphy covers charts, trends, moving averages, indicators, candlesticks, intermarket analysis, and other core concepts traders use to study price behavior.
Price: $34.27–$35.50
View Technical Analysis of the Financial Markets on Amazon →When Great-Looking Charts Fail: Evidence From PTJ Case Studies
One of the advantages of studying hundreds of real market setups is that you quickly discover how unreliable hindsight can be. Some charts that eventually collapsed looked extraordinarily bullish beforehand. And others, that I was sure were super high-probability short setups, bounced hard.
Here’s a look at a few examples that prove just how uncertain price action can be.
AFRM: A Bullish Setup That Quickly Fell Apart
AFRM initially looked like an A+ bullish post-earnings momentum setup.
The company beat EPS estimates by 45.45%, revenue grew roughly 33% year over year, guidance came in above expectations, and the first hourly earnings candle jumped +8.02%.
The stock also broke above hourly resistance and went on to produce a +7.95% maximum favorable excursion through after-hours and premarket trading.
Technically, there was plenty for a momentum trader to like. Yet the setup deteriorated rapidly after the next opening bell.
AFRM failed to hold its 6-9-12 EMA structure, formed a shooting-star candle, and then closed completely below the EMA cloud as sellers took control. What had looked like a strong continuation setup effectively transformed into a bearish reversal.
The bullish technical signals were real. They simply did not guarantee that bullish momentum would continue.
RDDT: A Textbook Bearish Breakdown That Eventually Reversed
RDDT provided almost the mirror image as an ideal example of a bearish post-earnings momentum setup.
Despite reporting 61.1% year-over-year revenue growth, an 8.04% revenue beat, and raised guidance, the stock immediately sold off. Its first hourly earnings candle dropped -8.05% and broke hourly support, creating what looked like a textbook bearish momentum setup.

Initially, the technical read worked extremely well. The short setup produced a 17.55% maximum favorable excursion with 0.00% adverse excursion, and RDDT finished the following session 14.23% below the first hourly close.
But the bearish move did not last. Buyers eventually returned, and within two trading days RDDT had rallied nearly 20% from its post-earnings low. Pasted text (2) Pasted text (2)
RDDT looked strongly bearish, and for a while it was. But even an exceptionally clean breakdown could not guarantee continued downside.
Together, AFRM and RDDT illustrate the same lesson from opposite directions: technical analysis can accurately describe strong momentum in the moment without being able to tell you how long that momentum will survive.
KKOD: When Technical Analysis Worked
KOD provides the opposite example, showing that technical analysis can work extremely well when momentum actually continues.
After positive Phase 3 trial results, the stock’s 6 a.m. catalyst candle closed roughly 56% higher, while KOD simultaneously broke out across the hourly, four-hour, and daily charts.

Elevated short interest and exceptionally strong pre-market momentum provided additional technical confirmation. Pasted text
In this case, the chart delivered exactly what momentum traders were looking for.
From the close of that catalyst candle, KOD produced an 80.2% maximum favorable excursion, experienced only -6.95% MAE, and remained above its 6-9-12 hourly EMAs throughout the session.
Even an end-of-day exit would have captured roughly a 69% gain from the hypothetical entry.
That’s massive!
So ultimately…
The lesson isn’t that technical analysis never works. Sometimes it works spectacularly. The problem is that traders cannot know beforehand how the next setup will behave.
Why Risk Management Matters More Than Technical Analysis
Technical analysis can help identify a promising setup, but position sizing and risk management determine how much damage a failed setup can ultimately actually do.
A trader does not need to be right all the time to make money.
For example, 40 winning trades averaging +$150 would generate +$6,000, while 60 losing trades averaging -$50 would lose -$3,000. Despite being right only 40% of the time, the strategy would still finish +$3,000 before fees and other costs.
The opposite is also possible. A trader who wins 80% of the time can still lose money if the occasional loser is allowed to become too large.
The Same Bad Trade Can Cause Very Different Damage
Potential dollar loss based on position size and percentage decline
| Position Size | -2% Loss | -5% Loss | -10% Loss | -15% Loss |
|---|---|---|---|---|
| $500 | -$10 | -$25 | -$50 | -$75 |
| $1,000 | -$20 | -$50 | -$100 | -$150 |
| $2,500 | -$50 | -$125 | -$250 | -$375 |
| $5,000 | -$100 | -$250 | -$500 | -$750 |
| $10,000 | -$200 | -$500 | -$1,000 | -$1,500 |
That is why an attractive chart should never justify reckless position sizing.
Higher conviction does not reduce the possibility of being wrong.
Before entering a trade, traders should already know their maximum acceptable loss, position size, potential stop level, risk-to-reward profile, and the point where the original thesis is no longer valid.
A trader doesn’t need to know what happens next. They need to know what they will do if what happens next isn’t what they expected.
In the long run, protecting capital when a setup fails can matter more than perfectly predicting the next candle.
Conclusion: Technical Analysis & Risk Management
Technical analysis is not a sham, but it is not a crystal ball either.
Charts, moving averages, candlestick patterns, breakouts, and momentum can all help traders identify opportunities, but none of them can guarantee what happens next.
The most important takeaway is that technical analysis should be used to evaluate probabilities, while risk management determines how much a failed setup can actually cost.
Ultimately, the goal is not to predict every move correctly. It is to survive the trades where your analysis is wrong.
Learn Technical Analysis Without Treating It Like a Crystal Ball
Learning technical analysis can make you better at recognizing market structure, trends, breakouts, momentum, and potential entry points. Learning risk management helps make sure you’re still trading when those setups don’t work.
John J. Murphy’s Technical Analysis of the Financial Markets is a comprehensive guide to the concepts behind many of the technical tools discussed throughout this article.
Price: $34.27–$35.50
View Technical Analysis of the Financial Markets on Amazon →If you want to go deeper:
- Explore the Trading Statistics Hub to understand how different sectors behave across market cycles
- Study real setups inside the Trade Reviews section
- Learn the framework behind high-probability setups in the Post-Earnings Momentum Strategy
This is how you turn raw market data into repeatable trading edge.
More Trading Statistics…


Frequently Asked Questions About Technical Analysis
What is the 3-5-7 rule in trading?
The 3-5-7 rule is an informal risk-management framework commonly described as risking no more than 3% of your account on one trade, limiting combined open risk to about 5%, and targeting winners that are meaningfully larger than losers, often expressed as roughly 7%. However, the term is not standardized, and different traders use “3-5-7” to describe different systems, so it should be treated as a guideline rather than an official trading rule. Quant Lab
Is technical analysis a sham?
No, technical analysis is not inherently a sham, but it becomes misleading when traders treat patterns and indicators as guarantees. Technical analysis can help identify trends, momentum, support, resistance, and potential entry or exit areas, but it is ultimately a way of analyzing probabilities rather than predicting the future with certainty.
What does Warren Buffett think of technical analysis?
Warren Buffett has long been skeptical of technical analysis. In a widely reported 2005 remark, he joked that he realized technical analysis did not work for him when he turned a chart upside down and still reached the same conclusion. Buffett ultimately favored Benjamin Graham-style fundamental analysis and investing based on the economics and value of businesses rather than chart patterns. The Washington Post
How do you do technical analysis for stocks?
Technical analysis typically starts by identifying the overall trend, followed by important support and resistance levels, trading volume, momentum, and relevant indicators such as moving averages. Traders can then identify a potential entry, establish where the setup would be invalidated, and determine their position size, stop level, and maximum acceptable risk before entering the trade.
Does technical analysis actually work?
Technical analysis can be useful for identifying market structure and potential trading opportunities, but that does not mean every signal works. Breakouts fail, moving averages get crossed, and bullish candlestick patterns can reverse. Its value comes from helping traders structure probabilistic decisions rather than providing certain predictions.
How accurate is technical analysis?
There is no universal accuracy rate for technical analysis. Results depend on the particular indicator or pattern, timeframe, market conditions, trading strategy, entry criteria, and how success is defined. A technical setup can also have a relatively low win rate and remain profitable if its winning trades are sufficiently larger than its losses.
Can technical analysis predict stock prices?
Technical analysis cannot reliably predict an exact future stock price. Instead, traders use historical price action, volume, trends, and other indicators to develop expectations about what may be more or less likely to happen next.
What is the biggest weakness of technical analysis?
The biggest weakness is that technical analysis is based largely on historical market behavior, while future market behavior is uncertain. A pattern that previously led to continuation can fail because of new information, changing sentiment, liquidity, broader market conditions, or simply because buyers and sellers behave differently the next time.
Which technical indicator is the most reliable?
There is no single technical indicator that is universally the most reliable. Moving averages, RSI, MACD, volume, support and resistance, and other tools can all provide useful information, but their effectiveness varies by market, timeframe, and strategy. Traders often look for several independent signals rather than relying on one indicator alone.
Is fundamental analysis better than technical analysis?
Fundamental and technical analysis generally answer different questions. Fundamental analysis asks what a company or asset may be worth based on factors such as earnings, growth, cash flow, and valuation, while technical analysis focuses more on what price is doing right now and how market participants are behaving.
Can you trade using only technical analysis?
Yes, some traders base their strategies almost entirely on technical analysis, but technical signals do not eliminate the need for risk management. Even a purely technical strategy still requires rules for position sizing, stops, trade invalidation, and controlling losses when a setup fails.
Why do breakouts fail?
Breakouts can fail when buying or selling pressure is not strong enough to sustain the move. Profit taking, low liquidity, broader market reversals, large opposing orders, new information, or traders quickly abandoning the breakout can all cause price to fall back through the level it initially broke.
Do candlestick patterns actually work?
Candlestick patterns can provide useful information about recent buying and selling behavior, but no candlestick pattern guarantees the next move. A hammer, engulfing candle, doji, or shooting star should therefore be treated as contextual evidence rather than a standalone prediction.
Do professional traders use technical analysis?
Yes, many professional traders use some form of technical analysis, particularly for timing, trend identification, momentum, support and resistance, and execution. However, the extent to which professionals rely on charts varies considerably, and technical analysis is often combined with fundamental, quantitative, macroeconomic, or risk-management frameworks.
Is technical analysis useful for long-term investing?
Technical analysis can still provide timing and market-context information for long-term investors, but long-term investing often places greater emphasis on fundamentals such as earnings growth, competitive advantages, cash flow, valuation, and financial strength. Technical analysis may therefore serve as a supplementary tool rather than the primary basis for a long-term investment thesis.
References
Murphy, J. J. (1999). Technical analysis of the financial markets: A comprehensive guide to trading methods and applications. Prentice Hall Press. PenguinRandomhouse.com
Paper Trading Journal. (2026, August 4). RDDT case study: Why bullish earnings can create both a perfect short and long opportunity. Paper Trading Journal.
Paper Trading Journal. (2026, August 31). AFRM case study: How to trade post-earnings momentum reversals. Paper Trading Journal.
Paper Trading Journal. (2026, September 29). KOD case study: How Kodiak Sciences exploded nearly 200% after Phase 3 trial results. Paper Trading Journal.
Tilson, W. (2005). Notes from meeting with Warren Buffett at Vanderbilt University. T2 Partners LLC.


Leave a Reply