

Momentum and mean reversion are not competing truths. They are opposing market behaviors that dominate under different conditions. In the following data dive, we compare momentum vs. mean-reversion trading to determine which strategy has better odds of success over the long term.

For decades, traders have debated one of the market’s oldest questions: does price continue trending more often, or is it more likely to snap back and revert toward the mean?
The data suggests both can be powerful strategies when applied with strict risk management.
Academic momentum research found that stocks with the strongest relative performance over the prior 3 to 12 months outperformed laggards by roughly 1% per month, making momentum one of the most well-documented market anomalies.
Meanwhile, short-term reversal studies show that sharp one-day winners and losers often mean-revert as emotional extremes fade.
Both camps think the other side is wrong. But markets don’t care about ideology.
And as any experienced trader knows, markets are neither purely trend-following nor purely mean-reverting. Which means that trading edge comes from knowing which regime you’re in and trading it appropriately.
Key Statistics – Mean Reversion Vs. Momentum Trading
- Stocks with the strongest prior 3- to 12-month returns outperformed laggards by roughly 1% per month, making momentum one of the most persistent market anomalies ever documented.
- One academic review found momentum winner portfolios outperformed losers by approximately 1.39% per month, reinforcing the long-term strength of trend-following strategies.
- Research by Lehmann found short-term contrarian mean reversion strategies generated abnormal returns of roughly 1% to 2% per week after extreme short-term moves.
- De Bondt and Thaler’s famous long-term reversal study found prior market losers significantly outperformed winners over 3- to 5-year holding periods, supporting long-horizon mean reversion.
- Research from AQR found momentum and trend-following effects have persisted across 200+ years of market history and multiple global asset classes.
- Academic studies suggest approximately 40% to 50% of stock momentum profits may be explained by sector and industry momentum effects, highlighting the importance of sector leadership.
- Research on opening range breakout (TORB) strategies found annualized returns exceeding 8% across five tested futures markets, with the strongest market producing 20.28% annual returns.
- A trader using a 2:1 reward-to-risk ratio only needs to win about 33.3% of trades before costs to break even.
- A trader targeting 3:1 reward-to-risk needs just 25% winning trades to mathematically achieve break-even expectancy.
- Momentum trading tends to perform best during institutional repricing, strong earnings reactions, and trending markets, while mean reversion strategies historically perform better during short-term emotional extremes and overextended price dislocations.

What Is Momentum Trading?
Momentum trading is a strategy built on the idea that stocks already moving strongly in one direction often continue moving that way for a period of time.
Rather than trying to predict reversals, momentum traders seek to profit from trend persistence, institutional buying, technical breakouts, and market underreactions to new information.
The best part about momentum trading is that it’s backed by decades of research.
One of the most famous momentum studies found that stocks with the strongest prior 3- to 12-month returns outperformed laggards by roughly 1% per month, helping establish momentum as one of the most persistent market anomalies in finance.
Momentum trading can take several forms, each built around the same core thesis: strong price action often leads to more strong price action—until market conditions change.
Trend Continuation Trading
Trend continuation trading is one of the purest forms of momentum trading. The strategy assumes that stocks already trending higher (or lower) are more likely to continue in that direction than suddenly reverse.
This approach is often supported by institutional accumulation, macro trends, sector strength, or improving fundamentals.
For example, a stock climbing steadily above its 20-day, 50-day, and 200-day moving averages with rising volume often attracts momentum traders betting on continued upside.
Trend continuation strategies tend to work best in strong directional markets, but struggle during choppy or range-bound conditions where false signals become more common.

Breakout Momentum Trading
Breakout trading focuses on stocks pushing through major resistance levels with strong volume and price expansion.
The theory behind breakout trading is simple: when price breaks through a well-established technical level, trapped sellers or buyers may be forced to liquidate, while momentum piles in, creating further continuation.
Classic breakout traders often watch:
- Previous highs
- Consolidation ranges (Darvas boxes)
- Multi-week resistance levels
- High-volume breakout candles
- All-time high breakouts
- Low of day breakdowns
- High of day breakouts
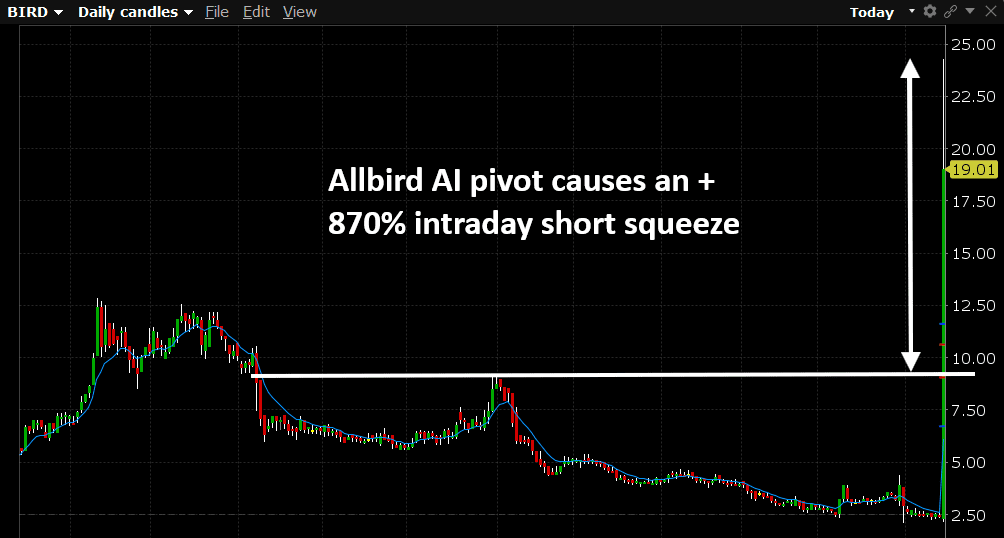
- Short squeeze trading
- Gamma squeeze trading
- Opening range breakouts
Research on timely opening range breakout (TORB) strategies found annual returns exceeding 8% in five tested markets, with the best-performing market generating 20.28% annual returns.
However, not all breakouts succeed.
Failed breakouts are one of the biggest risks of this momentum strategy—especially in weak market environments or low-volume setups.
Post-Earnings Momentum Trading
One of the most academically supported forms of momentum trading is post-earnings announcement drift (PEAD).
This phenomenon occurs when stocks continue trending in the direction of an earnings surprise long after the initial earnings reaction, suggesting markets do not always instantly price in new information.
For example, if a company beats earnings expectations, raises guidance, and the stock surges 10% to 15% after hours, that move may represent institutional repricing rather than short-term overextension.
This aligns closely with my own post-earnings momentum strategy, which focuses on stocks making major earnings-driven moves with strong multi-timeframe technical confirmation.

Relative Strength Momentum Trading
Relative strength momentum trading involves buying the strongest stocks in the strongest sectors while avoiding—or shorting—the weakest names.
Rather than focusing on chart patterns alone, this strategy seeks stocks consistently outperforming peers or the broader market, based on the idea that leadership often persists longer than expected.
Academic research strongly supports this concept. The landmark Jegadeesh and Titman study found that stocks with the strongest prior 3- to 12-month returns outperformed laggards by roughly 1% per month, making relative strength one of the most well-documented market anomalies.
Additional research from AQR found momentum effects have persisted across 200+ years of market history and multiple asset classes.
For example, if tech stocks are outperforming the S&P 500 and one stock within that group shows exceptional strength, momentum traders may expect institutional buying to continue pushing leaders higher.
Sector Momentum Rotation
Momentum can also emerge at the sector level as institutional capital rotates into market leadership themes.
Sector momentum rotation involves identifying industries consistently outperforming the broader market and positioning alongside those trends.
Academic research suggests this approach has merit, with studies finding roughly 40% to 50% of stock momentum profits may be explained by industry-level effects, highlighting the importance of sector leadership.
When institutions aggressively allocate capital toward themes like AI, energy stocks, or financials, those flows often unfold over weeks or months—not just a single session.
For example, if AI stocks attract strong inflows while defensive sectors weaken, momentum traders may rotate capital toward the strongest corner of the market rather than fighting the trend.
Moving Average Crossover Momentum Trading
Moving average crossover strategies are another widely used momentum trading approach.
These setups generate signals when shorter-term moving averages cross above longer-term averages, suggesting bullish momentum may be accelerating.

Popular examples include:
- 50-day moving average crossing above the 200-day moving average (golden cross)
- 20-day crossing above the 50-day
- 9 EMA crossing above longer short-term trend averages
Momentum traders use these signals to confirm trend strength, although crossover strategies often lag price action because moving averages rely on historical data.
As a result, crossover systems tend to perform better in sustained trends than in sideways markets where repeated crossovers can generate false signals.
What Is Mean Reversion Trading?
Mean reversion trading is based on the idea that extreme price moves often reverse over time, with stocks eventually moving back toward historical averages or fair value.
Rather than chasing momentum, mean reversion traders seek to profit from overbought rallies, panic selloffs, failed breakouts, and overstretched price action.
Mean reversion also has similarly strong academic support, particularly over short-term and long-term horizons.
Mean reversion trading can take several forms, all built around the same thesis: when price moves too far, too fast, reversal risk increases.
Short-Term Reversal Trading
Short-term reversal trading assumes stocks making extreme short-term moves are more likely to snap back.
Research by Lehmann found contrarian reversal strategies produced abnormal returns of roughly 1% to 2% per week in some historical samples.
For example, a stock dropping 10%+ in a single session without a major catalyst may attract traders looking for an oversold bounce.
Gap Fill Trading
Gap fill trading is a classic mean reversion strategy built around the idea that sharp overnight gaps often partially retrace.
Traders commonly watch:
- earnings gaps
- news-driven gaps
- premarket overextensions
- low-float hype moves
For example, a speculative stock gapping 20% higher at the open may attract traders betting on a retracement if the move lacks strong fundamentals.

RSI Mean Reversion Trading
Many traders use the Relative Strength Index (RSI) to spot stretched price action.
Classic thresholds include:
- RSI above 70 = overbought
- RSI below 30 = oversold
The theory is simple: extreme momentum often becomes unsustainable.
That said, strong trends can stay overbought or oversold longer than expected, making RSI best used alongside other confirmation signals.
Failed Breakout Reversal Trading
As shown above, not all breakouts continue. Failed breakout trading involves fading false moves when price breaks resistance, attracts momentum traders, then quickly reverses.
For example, a stock breaking all-time highs before collapsing back below resistance can trigger a fast reversal as trapped breakout buyers exit.

Moving Average Mean Reversion Trading
Some traders use moving averages as reversion anchors.
Rather than buying momentum, they look for stocks trading far above or below key levels like the:
- 20-day moving average
- 50-day moving average
- VWAP
- 200-day moving average
For example, a stock trading 15% to 20% above its 20-day average after a short squeeze may be viewed as ripe for mean reversion.
Momentum Vs Mean Reversion Statistics: Which Strategy Has Better Odds?
If you’re looking for a definitive winner between momentum and mean reversion trading, you’re asking the wrong question. Academic research suggests both strategies can generate abnormal returns.
The real question is: Which is the best strategy right now?
Academic research has repeatedly found that momentum works best over intermediate timeframes. Whereas, a later review found past winners outperformed past losers by 1.39% per month, which was close to the original momentum findings.
On the other hand, mean reversion also has strong evidence behind it, but usually over shorter or longer horizons.

Lehmann’s research found that stocks with extreme one-week gains or losses often reversed the following week, producing apparent arbitrage profits of roughly 1% to 4% per week before costs in historical samples.
Similarly, De Bondt and Thaler found that portfolios of prior losers outperformed prior winners over multi-year periods, supporting the idea that markets can often overreact and later correct.
So the better question is not: Does momentum beat mean reversion? – It’s which market behavior is dominant right now?
Momentum tends to have better odds when price is being repriced by new information, such as earnings surprises, guidance upgrades, institutional accumulation, sector rotation, or major technical breakouts.
Mean reversion tends to have better odds when price has moved too far without enough fundamental support, such as panic selling, low-volume spikes, failed breakouts, short-term exhaustion, or speculative gap moves.
The Expectancy Math Matters More Than Being “Right”
Ultimately, risk management and obtaining an adequate risk-to-reward ratio become the deciding factor. A strategy does not need to win 70% of the time to be profitable. It needs positive expectancy over a large number of trades.
The formula is: Expectancy = (Win Rate × Average Win) − (Loss Rate × Average Loss) –
So, for example:
| Win Rate | Avg Win | Avg Loss | Expectancy |
|---|---|---|---|
| 35% | +9% | -3% | +1.20% per trade |
| 40% | +8% | -4% | +0.80% per trade |
| 50% | +5% | -3% | +1.00% per trade |
| 60% | +3% | -2% | +1.00% per trade |
This is why both strategies can work.
A momentum trader can be profitable with a lower win rate if winners are large enough. A mean reversion trader can be profitable with smaller average wins if the win rate is high enough and losses are controlled.
Break-Even Win Rate by Risk/Reward
| Risk/Reward Ratio | Break-Even Win Rate |
|---|---|
| 1:1 | 50.0% |
| 2:1 | 33.3% |
| 3:1 | 25.0% |
| 4:1 | 20.0% |
That means a trader targeting 3R winners only needs to win slightly more than 25% of trades before costs to have positive expectancy.
This is the key point: momentum vs mean reversion is not a religion. It is a regime question.
Momentum has stronger academic support over intermediate-term horizons. Mean reversion has stronger support after short-term extremes and long-term overreactions.
The best traders are not loyal to one side or the other. They are loyal to probability.
Markets are neither purely trend-following nor purely mean-reverting. The edge comes from knowing which regime you’re in—and applying risk management strict enough to survive being wrong.
Final conclusion – Momentum Vs Mean-Reversion Trading
So, which trading edge actually works: momentum or mean reversion?
The data suggests both can be profitable under the right conditions. But the real edge is not blindly following any one strategy.
It’s understanding different chart patterns, market regimes, volatility, and trading volume, as well as applying disciplined risk management, and structuring trades with a risk-to-reward ratio that supports positive expectancy over a large sample size.
The market does not reward ideology. It rewards adaptation.
Momentum works. Mean reversion works. But neither works blindly.
The traders who survive are the ones who understand context, respect risk, and stay loyal to probability—not ego.
If you want to go deeper:
- Explore the Trading Statistics Hub to understand how different sectors behave across market cycles
- Study real setups inside the Trade Reviews section
- Learn the framework behind high-probability setups in the Post-Earnings Momentum Strategy
This is how you turn raw market data into repeatable trading edge.
More Trading Statistics…


FAQs – Momentum and Mean-Reversion Trading Strategies
Is momentum trading better than mean reversion trading?
Neither strategy is universally better. Academic research suggests momentum trading tends to perform better over intermediate-term timeframes, particularly when markets are repricing new information or institutional capital is driving sustained trends. Mean reversion strategies often perform better after emotionally overextended moves, failed breakouts, or panic-driven selloffs. The better strategy depends on market conditions.
Which has a higher win rate: momentum or mean reversion?
Mean reversion strategies often produce higher win rates because many short-term price extremes do partially reverse. However, momentum strategies can remain highly profitable even with lower win rates if the average winning trade is significantly larger than the average loss. This is why expectancy matters more than win rate alone.
Can both momentum and mean reversion trading be profitable?
Yes. Both strategies have decades of academic support and real-world application. Momentum strategies exploit trend persistence and market underreaction, while mean reversion strategies capitalize on overreaction and emotional price dislocations. Profitability ultimately depends on execution, market regime, and risk management.
What is the biggest risk of momentum trading?
The biggest risk in momentum trading is buying exhaustion instead of genuine continuation. Strong-looking breakouts can fail quickly, especially in weak markets, low-volume setups, or speculative hype moves. Chasing extended price action without confirmation is one of the most common momentum trading mistakes.
What is the biggest risk of mean reversion trading?
The biggest risk in mean reversion trading is fading a move that is fundamentally justified. Stocks can remain overbought or oversold far longer than traders expect, particularly when strong catalysts, institutional flows, or major trend shifts are involved. Trying to catch a reversal too early can be costly.
Is post-earnings momentum a momentum strategy or a mean reversion strategy?
Post-earnings momentum is generally considered a momentum strategy. Research on post-earnings announcement drift (PEAD) suggests markets do not always instantly price in earnings surprises, allowing strong moves to continue beyond the initial reaction. However, weak earnings gaps without strong fundamentals may behave more like mean reversion setups.
Do gaps always fill?
No. While many overnight gaps partially retrace, gaps do not always fill—especially when price is repricing legitimate new information such as earnings surprises, analyst upgrades, or macro catalysts. Blindly assuming all gaps will close is a common trading mistake.
What risk-to-reward ratio do traders need to be profitable?
That depends on win rate. For example:
- 1:1 risk/reward = 50% break-even win rate
- 2:1 risk/reward = 33.3% break-even
- 3:1 risk/reward = 25% break-even
- 4:1 risk/reward = 20% break-even
This is why traders with very different strategies can both achieve positive expectancy.
Is momentum or mean reversion better for beginners?
Neither is inherently easier. Momentum trading requires patience, discipline, and avoiding emotional chasing. Mean reversion requires precise timing and the ability to avoid stepping in front of strong trends. Beginners are often better served by focusing on one clearly defined setup rather than mixing multiple strategies too early.
What is the most important takeaway from momentum vs mean reversion trading?
The most important lesson is that markets are neither purely trend-following nor purely mean-reverting. Both behaviors exist. The edge comes from identifying the current market regime, choosing the appropriate strategy, and managing risk well enough to survive when the market proves you wrong.
Sources
AQR Capital Management. (2014). A century of evidence on trend-following investing. AQR Capital Management. https://www.aqr.com/Insights/Research/White-Papers/A-Century-of-Evidence-on-Trend-Following-Investing
Asness, C. S., Moskowitz, T. J., & Pedersen, L. H. (2013). Value and momentum everywhere. The Journal of Finance, 68(3), 929–985. https://doi.org/10.1111/jofi.12021
De Bondt, W. F. M., & Thaler, R. (1985). Does the stock market overreact? The Journal of Finance, 40(3), 793–805. https://doi.org/10.2307/2327804
Gatev, E., Goetzmann, W. N., & Rouwenhorst, K. G. (2006). Pairs trading: Performance of a relative-value arbitrage rule. The Review of Financial Studies, 19(3), 797–827. https://doi.org/10.1093/rfs/hhj020
Jegadeesh, N., & Titman, S. (1993). Returns to buying winners and selling losers: Implications for stock market efficiency. The Journal of Finance, 48(1), 65–91. https://doi.org/10.1111/j.1540-6261.1993.tb04702.x
Lehmann, B. N. (1990). Fads, martingales, and market efficiency. The Quarterly Journal of Economics, 105(1), 1–28. https://doi.org/10.2307/2937816
Moskowitz, T. J., Ooi, Y. H., & Pedersen, L. H. (2012). Time series momentum. Journal of Financial Economics, 104(2), 228–250. https://doi.org/10.1016/j.jfineco.2011.11.003
Park, C. H., & Irwin, S. H. (2007). What do we know about the profitability of technical analysis? Journal of Economic Surveys, 21(4), 786–826. https://doi.org/10.1111/j.1467-6419.2007.00519.x
Seyhun, H. N. (1990). Overreaction or fundamentals: Some lessons from insiders’ response to the market crash of 1987. The Journal of Finance, 45(5), 1363–1388. https://doi.org/10.1111/j.1540-6261.1990.tb03719.x
Tomasini, E., & Jaekle, C. (2009). Trading systems: A new approach to system development and portfolio optimisation. Harriman House.
Zarattini, M., Aziz, S., & Barbon, A. (2019). Assessing the profitability of timely opening range breakout on index futures markets. SSRN Electronic Journal. https://doi.org/10.2139/ssrn.3359798


Leave a Reply