

In this article, you’ll learn why stocks go up over time, how gross margin, operating margin, EPS, free cash flow, and valuation help explain changes in a company’s underlying value, and why free cash flow per share can be especially important for long-term investors. We’ll also connect these concepts to Warren Buffett and the Interpretation of Financial Statements by Mary Buffett and David Clark, which explains how financial statements can reveal whether a company may have a durable competitive advantage.

Figuring out whether a stock will rise or fall is never as simple as looking at one financial ratio. After all, a stock can beat earnings and still fall, or miss on earnings expectations and still rally.
It’s never as simple as it seems. Stock prices tend to move because of earnings, interest rates, economic conditions, investor expectations, valuation, and changes in market sentiment.
Fundamental analysis helps investors look beyond that noise.
By examining revenue, margins, cash flow, debt, returns on capital, and valuation, we can better understand whether the underlying business is actually becoming more valuable.
One book that shaped how I think about these numbers is Warren Buffett and the Interpretation of Financial Statements by Mary Buffett and David Clark.
It shows investors how to use financial statements to identify strong businesses with durable competitive advantages, rather than treating them as simple accounting exercises.
In this article, we’ll use that same approach to answer a deceptively simple question:
Why do stocks go up?
We’ll look at gross margins, profitability, and free cash flow, with particular attention to why growing free cash flow per share can be one of the clearest signs that a company’s underlying value is increasing.
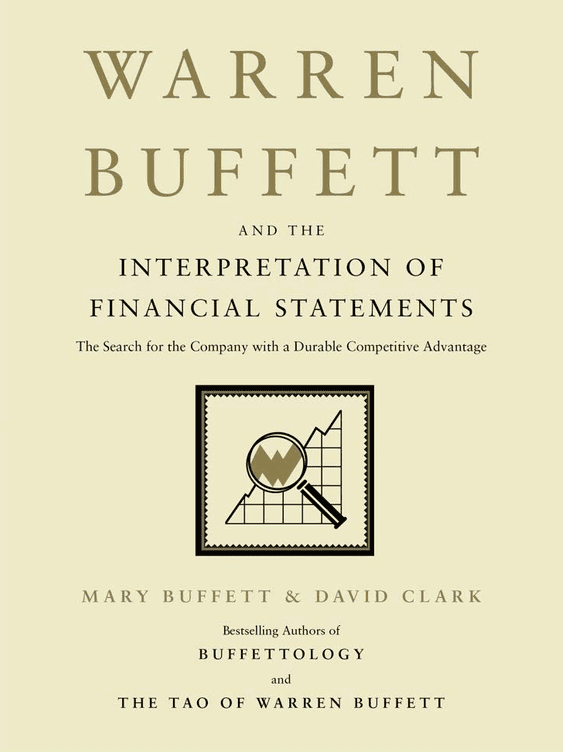
Warren Buffett and the Interpretation of Financial Statements
Learn how to evaluate margins, earnings, debt, cash flow, and other financial metrics through the lens of durable competitive advantage.
Quick Answer: What Makes a Stock Go Up?
Understanding financial statements isn’t all that simple, especially for those who are new to accounting, business, trading or investing. But ultimately, stocks go up when investors are willing to pay more for each share, often because the underlying business is becoming more valuable. For example, if free cash flow rises from $500 million to $1 billion while the share count stays at 100 million, free cash flow per share doubles from $5 to $10. If the valuation multiple stays similar, the stock’s fundamental value could theoretically rise by a similar amount. Revenue, margins, EPS, cash flow, debt, and valuation can all help explain whether that value is improving.
Key Statistics: What Drives Stock Prices Higher or Lower?
No ratio can reliably predict tomorrow’s price, but research shows that profitability, earnings growth, revenue surprises, and cash-flow growth can matter for stock returns over time.
A 2021 Journal of Financial Research study found a positive relationship between free-cash-flow growth and expected stock returns, with information beyond profits and dividends.
Robert Novy-Marx’s 2013 research found gross profitability had strong explanatory power for average returns, with more profitable firms outperforming less profitable ones in the sample.
Research in the Journal of Financial Economics found that cash-based operating profitability outperformed accrual-heavy profitability measures in explaining average returns.
Across 377,907 firm-quarter observations, earnings acceleration was linked with roughly +1.8% one-month and +3.4% one-quarter market-adjusted returns.
Journal of Accounting and Economics research found that unexpected revenue was associated with stock-price reactions, even after controlling for earnings surprises.
Research across developed and emerging markets found long-run stock performance was strongly influenced by corporate earnings and EPS growth.
A Review of Accounting Studies paper found that expected EPS growth was strongly reflected in valuation ratios, though return predictability remained limited.
Fama and French added profitability and investment to their five-factor model, improving its explanation of average stock returns.
The Big Takeaway
Strong margins or rising cash flow do not guarantee a higher stock price. But research suggests that earnings, cash generation, profitability, and growth can meaningfully influence what investors are willing to pay for a business over time.
What Is Gross Margin?
Gross margin is one of the simplest financial ratios investors can use to understand how profitable a company’s underlying product or service actually is.
The formula is: Gross Margin = (Revenue – Cost of Goods Sold) ÷ Revenue
Suppose Company A generates $1 billion in annual revenue and incurs $700 million in costs directly associated with producing what it sells. That leaves the company with $300 million of gross profit and a 30% gross margin.
Company B also generates $1 billion in revenue, but its cost of goods sold is only $400 million. It produces $600 million in gross profit and has a 60% gross margin.
Both companies generate exactly the same amount of revenue, but Company B has twice as much gross profit left over to pay employees, fund research, advertise, cover corporate expenses, pay interest and taxes, and ultimately generate income and cash for shareholders.
This is why revenue growth alone doesn’t tell us very much about how valuable a business is becoming. A company can increase its sales significantly while simultaneously allowing its margins to deteriorate.
Consider another example, where a company with $1 billion in revenue and a 50% gross margin. It generates $500 million in gross profit.
If revenue climbs 20% to $1.2 billion but gross margin falls to 35%, gross profit actually falls to $420 million. The company just generated another $200 million in sales while producing $80 million less gross profit.
That is an important distinction for traders and investors. What matters isn’t simply how much money passes through the business, but how much of that money the company ultimately gets to keep.
Learn How to Actually Read These Financial Ratios
We’ve covered gross margin, earnings, debt, cash flow, ROE, and valuation. Warren Buffett and the Interpretation of Financial Statements goes a step further by showing how these numbers fit together when evaluating the quality of a business.
Where Does Every $1 of Revenue Go?
A 60% gross margin means the company keeps $0.60 from every $1 of revenue before operating expenses, interest, and taxes.
What is Meant by Operating Margin?
Gross profit doesn’t become shareholder profit automatically. Companies still need to pay employees, market their products, develop new technology, operate offices, maintain infrastructure, and cover numerous other business expenses.
That’s where operating margin comes into play. Operating margin tells us how much profit remains after those operating costs.
Operating Margin = Operating Income ÷ Revenue
Suppose a company produces $1 billion in revenue and $600 million in gross profit. If it spends another $400 million operating the business, it generates $200 million in operating income and has a 20% operating margin.
Operating margin can reveal something gross margin cannot.
A company might have an excellent product with very high gross margins but still operate inefficiently because management spends nearly everything the company earns.
On the other hand, another business might have lower gross margins but incredibly disciplined operating expenses.
Looking at both ratios helps us understand not only whether a company’s products are profitable, but whether management can turn that gross profit into operating earnings.
From Revenue to Operating Profit
A 20% operating margin means the company keeps $0.20 in operating profit for every $1 of revenue after direct costs and operating expenses.
Net Profit Margin
Net profit margin takes us one step closer to what shareholders actually own.
After operating costs, companies may still need to pay interest on debt, taxes, and other expenses. Whatever remains becomes net income.
Net Profit Margin = Net Income ÷ Revenue
If a company generates $10 billion in sales and ultimately produces $1 billion in net income, its net profit margin is 10%. The company is effectively converting every $1 of revenue into about $0.10 of accounting profit.
This is where margin expansion can become especially powerful. If revenue increases while net margins also improve, earnings can grow considerably faster than sales.
Imagine a company growing revenue from $10 billion to $11 billion, an increase of just 10%. If its net margin simultaneously improves from 10% to 15%, net income increases from $1 billion to $1.65 billion, or 65%.
That difference helps explain why investors should care about margins rather than focusing exclusively on revenue growth.
What Actually Reaches the Bottom Line?
A 10% net profit margin means the company ultimately keeps $0.10 of every $1 in revenue as net income after operating expenses, interest, taxes, and other costs.
What is Free Cash Flow?
This is where we start getting particularly close to the economic engine behind a stock. In other words, free cash flow brings us much closer to the economic drivers of long-term stock-price appreciation.
Accounting earnings tell us how profitable a company appears under accounting rules. Free cash flow tells us how much cash the business is actually generating after funding the capital expenditures required to maintain and grow its operations.
A commonly used simplified formula is:
Free Cash Flow = Operating Cash Flow – Capital Expenditures
If a company produces $2 billion in operating cash flow and spends $500 million on capital expenditures, it generates approximately $1.5 billion in free cash flow.
That money can potentially be used to repurchase shares, pay dividends, reduce debt, make acquisitions, invest in new products, or simply accumulate on the balance sheet.
This is why free cash flow is so important. Businesses ultimately have value because of their ability to generate cash for their owners.
How Much Cash Is Actually Left Over?
Free cash flow shows the cash left after funding the business. When free cash flow per share keeps rising, each share represents a claim on more cash-generating power over time.
Why Free Cash Flow PER SHARE Matters Even More
Total free cash flow is useful, but shareholders ultimately own a portion of that cash flow through each share. That makes free cash flow per share especially important.
Free Cash Flow Per Share = Free Cash Flow ÷ Shares Outstanding
If a company grows free cash flow from $1 billion to $1.5 billion while keeping its share count unchanged, free cash flow per share rises by 50%.
Each share now represents a claim on 50% more annual cash flow.
If investors continue valuing the company at roughly the same free-cash-flow multiple, that growth can translate directly into a higher theoretical stock value.
More cash generated per share gives the market more underlying value per share to price.
Learn What Growing Cash Flow Really Means for Shareholders
Free cash flow per share helps show whether each individual share is becoming more economically valuable. Warren Buffett and the Interpretation of Financial Statements can help you better understand the financial statements behind that cash generation.
Share Dilution Can Change the Story
This is also why per-share figures matter.
Suppose that same company grows free cash flow from $1 billion to $1.5 billion, an impressive 50% increase. But during the same period it issues another 50 million shares.
The company now has 150 million shares outstanding.
Free cash flow per share is:
$1.5 billion ÷ 150 million = $10.
Total free cash flow increased 50%. But free cash flow per share didn’t increase at all. Existing shareholders therefore aren’t receiving the same economic benefit that the headline free-cash-flow growth might suggest.
That said, the opposite can happen when companies repurchase shares and shrink the number of total shares outstanding. If free cash flow rises while the number of shares outstanding declines, free cash flow per share can grow even faster than total free cash flow.
That is why I prefer examining free cash flow per share over time, rather than looking exclusively at total free cash flow.
What Else Should Investors Look At?
Free cash flow is powerful, but no single metric tells the whole story. These ratios help investors evaluate profitability, capital efficiency, financial risk, and valuation.
How efficiently is shareholder capital being used?
ROE measures how much net income a company generates from shareholders’ equity.
High ROE can signal strong economics, but heavy debt can artificially boost the ratio.
How well does the business compound invested capital?
ROIC measures how efficiently a company generates returns from the capital invested in its operations.
Companies that can repeatedly reinvest at high returns can compound value rapidly over time.
How much financial risk is the company carrying?
Debt can accelerate growth, but it also increases risk and commits future cash flow to creditors.
Two companies with the same cash flow can have very different risk profiles depending on their debt loads.
How much are investors paying for those fundamentals?
A great company can still be a poor investment if the market price already assumes exceptional growth.
$10 of FCF per share at $100 = 10× FCF; at $400 = 40× FCF.
The goal isn’t to find one perfect ratio. It is to combine profitability, cash flow, capital efficiency, debt, and valuation to build a clearer picture of the business.
The Two Engines Behind a Rising Stock
Long-term stock gains usually come from two places:
The business becomes more valuable per share, or investors become willing to pay a higher valuation for those fundamentals.
Suppose a company earns $5 per share and trades at 20× earnings, giving it a theoretical value of $100. If EPS later doubles to $10 and the P/E stays at 20×, the value rises to $200.
If investors also raise the multiple to 30×, the theoretical value jumps to $300. That is the combination of fundamental growth and multiple expansion.
The reverse can happen too. If EPS doubles to $10 but the P/E falls to 10×, the stock is still worth only $100.
The same logic applies to free cash flow. In simple terms:
Stock Value ≈ Free Cash Flow Per Share × Valuation Multiple
Growing free cash flow per share gives each share a larger economic base, but the market still decides how much it is willing to pay for it.
Understand the Business Behind Long-Term Price Appreciation
Long-term stock gains are often supported by rising earnings, stronger cash flow, high returns on capital, and improving per-share economics. Warren Buffett and the Interpretation of Financial Statements shows how to find those traits inside a company’s financial statements.
Why Durable Competitive Advantages Matter
This brings us back to Warren Buffett and the Interpretation of Financial Statements.
The real prize isn’t simply finding a company with a high gross margin or good free cash flow this year. It’s finding a business capable of maintaining those economics for a very long time.
That usually requires some form of durable competitive advantage.
These advantages can include strong brands, economies of scale, network effects, intellectual property, customer switching costs, cost advantages, unique distribution networks, or great products that are extremely difficult to replace.
Competitive advantages can protect margins. Protected margins can produce strong profits. Strong profits can create free cash flow. Free cash flow can then be reinvested at attractive rates, used to reduce debt, distributed to investors, or used to repurchase shares.
If the company can repeat that cycle for decades, the numbers can compound dramatically. And that is ultimately what makes a durable competitive advantage so valuable.
Warren Buffett and the Interpretation of Financial Statements
Mary Buffett and David Clark explain how to read financial statements through the lens of business quality and durable competitive advantage. Instead of treating accounting as a collection of numbers, the book asks what those numbers reveal about the economics of the company.
The book won’t tell you whether a stock will rise tomorrow, but it can help you identify companies with strong margins, manageable debt, rising earnings, and durable cash-generating power.
Conclusion: Why Do Stocks Go Up?
There is no financial ratio that can tell you exactly where a stock will trade tomorrow, a week from now, or a year from now.
Markets are driven by expectations, interest rates, sentiment, valuation, economic conditions, and countless other variables that can overwhelm fundamentals in the short term.
Either way, the important takeaway is that businesses have economic value because they generate profits and cash.
If a company can consistently grow revenue, protect its margins, generate more free cash flow, and most importantly increase the amount of free cash flow attributable to each share, then each share represents ownership in an increasingly productive business.
The stock price may not follow immediately. Over time, however, more cash per share gives the market more value per share to price.
That’s a simple idea. Buying and investing in stocks is still more complicated and convoluted than that. But it’s one of the most important concepts an investor can understand.


If you want to go deeper:
- Explore the Trading Statistics Hub to understand how different sectors behave across market cycles
- Study real setups inside the Trade Reviews section
- Learn the framework behind high-probability setups in the Post-Earnings Momentum Strategy
This is how you turn raw market data into repeatable trading edge.
More Trading Statistics…


Frequently Asked Questions
Why do stocks go up?
Stocks go up when buyers are willing to pay increasingly higher prices for shares. Over longer periods, higher prices are often supported by growth in earnings, free cash flow, profitability, and expectations for future growth, although valuation and market sentiment also matter.
Does higher revenue make a stock go up?
Not necessarily. Revenue growth can be positive, but investors also need to consider margins, expenses, cash flow, share dilution, and valuation.
A company can grow revenue while simultaneously producing less profit or free cash flow.
Does EPS growth make stocks go up?
EPS growth can support long-term stock appreciation because each share represents a claim on more corporate earnings. However, a rising EPS does not guarantee a rising stock price because valuation multiples and investor expectations can change at the same time.
What is gross margin?
Gross margin measures how much revenue remains after subtracting the direct costs of producing a company’s goods or services.
Gross Margin = (Revenue – Cost of Goods Sold) ÷ Revenue
What does a 40% gross margin mean?
A 40% gross margin means a company generates $0.40 of gross profit for every $1 of revenue. The remaining $0.60 covers the direct costs associated with producing its goods or services.
What does a 20% gross margin mean?
A 20% gross margin means the company retains $0.20 in gross profit for every $1 of revenue after cost of goods sold. It still needs to pay operating expenses, interest, taxes, and other costs from that amount.
What does a 70% gross profit margin mean?
A 70% gross margin means a business keeps $0.70 of gross profit from every $1 of revenue before operating expenses and other costs. Whether 70% is considered high depends heavily on the company’s industry and business model.
What is the difference between gross profit and gross margin?
Gross profit is a dollar amount, while gross margin expresses that profit as a percentage of revenue.
For example, $100 million in revenue with $40 million in gross profit produces a 40% gross margin.
Is a higher gross margin always better?
Not necessarily. Higher margins generally provide more room to cover expenses and generate profits, but margin structures vary significantly between industries.
It is usually more useful to compare a company’s margins with its own historical results and those of similar competitors.
How do you calculate operating margin?
Operating margin is calculated by dividing operating income by revenue:
Operating Margin = Operating Income ÷ Revenue
If a company produces $200 million in operating income from $1 billion in revenue, its operating margin is 20%.
What does a 30% operating margin mean?
A 30% operating margin means a company generates $0.30 of operating profit from every $1 of revenue after accounting for the costs of running the business but before certain items such as taxes and, depending on presentation, financing costs.
Is operating margin the same as EBIT?
They are closely related, but not always identical. Operating margin usually uses operating income divided by revenue, while EBIT represents earnings before interest and taxes.
For many companies the figures are similar, but differences can arise from how non-operating income and expenses are classified.
What is free cash flow?
Free cash flow is the cash a company generates after paying for the capital expenditures needed to maintain and grow the business.
A commonly used simplified formula is:
Free Cash Flow = Operating Cash Flow – Capital Expenditures
How is free cash flow calculated?
A common calculation starts with cash generated from operating activities and subtracts capital expenditures.
For example, if a company generates $2 billion in operating cash flow and spends $500 million on capital expenditures, it produces approximately $1.5 billion in free cash flow.
What is the difference between cash flow and free cash flow?
Cash flow is a broad term describing cash moving into and out of a business. Free cash flow specifically measures the cash left from operations after capital expenditures.
This makes free cash flow particularly useful when evaluating how much cash remains available for debt reduction, dividends, buybacks, acquisitions, or reinvestment.
Why is free cash flow per share important?
Free cash flow per share shows how much free cash flow is attributable to each outstanding share.
A company can grow total free cash flow while issuing enough new shares that existing shareholders receive little benefit. Free cash flow per share helps reveal whether the economics supporting each individual share are actually improving.
Does increasing free cash flow per share mean a stock will rise?
Not necessarily. Rising free cash flow per share can increase the fundamental value supporting each share, but stock prices also depend on valuation, interest rates, growth expectations, economic conditions, and market sentiment.
A company can increase free cash flow per share while its stock falls if investors simultaneously become willing to pay a lower valuation multiple.
What is the relationship between free cash flow and stock price?
Free cash flow represents cash that can potentially be reinvested, used to reduce debt, distributed to shareholders, or deployed toward other opportunities.
Over time, growing free cash flow per share can provide a larger fundamental base for the market to value, although changes in valuation can strengthen or weaken the relationship between cash-flow growth and stock-price appreciation.
Is EBITDA the same as free cash flow?
No. EBITDA measures earnings before interest, taxes, depreciation, and amortization, while free cash flow attempts to measure actual cash remaining after operating cash generation and capital expenditures.
A company can report strong EBITDA while producing relatively little free cash flow, particularly if the business requires heavy capital spending.
What financial ratios should investors look at?
Useful metrics include gross margin, operating margin, net profit margin, EPS, free cash flow per share, return on equity, return on invested capital, debt ratios, P/E, and price-to-free-cash-flow.
No single ratio tells the entire story, so investors generally get a clearer picture by examining several measures together.
Why do profitable companies sometimes have falling stock prices?
Stock prices reflect expectations about the future rather than current profits alone. A profitable company’s shares can fall if results disappoint expectations, growth forecasts decline, interest rates rise, or investors become unwilling to pay the previous valuation multiple.
What is a durable competitive advantage?
A durable competitive advantage is a business characteristic that competitors have difficulty reproducing and that can help a company maintain attractive economics over long periods.
Examples include strong brands, economies of scale, switching costs, network effects, patents, proprietary technology, cost advantages, and unique distribution systems.
References
Ball, R., Gerakos, J., Linnainmaa, J. T., & Nikolaev, V. V. (2016). Accruals, cash flows, and operating profitability in the cross section of stock returns. Journal of Financial Economics, 121(1), 28–45. https://doi.org/10.1016/j.jfineco.2016.03.002
Buffett, M., & Clark, D. (2008). Warren Buffett and the interpretation of financial statements: The search for the company with a durable competitive advantage. Scribner.
Fama, E. F., & French, K. R. (2015). A five-factor asset pricing model. Journal of Financial Economics, 116(1), 1–22. https://doi.org/10.1016/j.jfineco.2014.10.010
He, S., & Narayanamoorthy, G. (2020). Earnings acceleration and stock returns. Journal of Accounting and Economics, 69(1), 101238. https://doi.org/10.1016/j.jacceco.2019.101238
Jansen, B. A. (2021). Cash flow growth and stock returns. Journal of Financial Research, 44(2), 371–402. https://doi.org/10.1111/jfir.12244
Jegadeesh, N., & Livnat, J. (2006). Revenue surprises and stock returns. Journal of Accounting and Economics, 41(1–2), 147–171. https://doi.org/10.1016/j.jacceco.2005.10.003
Novy-Marx, R. (2013). The other side of value: The gross profitability premium. Journal of Financial Economics, 108(1), 1–28. https://doi.org/10.1016/j.jfineco.2013.01.003
Sloan, R. G., & Wang, A. Y. (2025). Predictable EPS growth and the performance of value investing. Review of Accounting Studies, 30, 33–78. https://doi.org/10.1007/s11142-023-09812-6


Leave a Reply