

In this review, you’ll learn what Technical Analysis For Dummies covers, where the book does a good job explaining core concepts like candlesticks and moving averages, where it falls short, and whether it’s a useful starting point for beginner traders who want to build a stronger technical analysis foundation.

If you’re new to charting and want to understand what traders are actually looking at when they talk about moving averages, candlesticks, support, resistance, momentum, and trends, Technical Analysis For Dummies is a solid trading book to add to your reading list.
I’ve personally read Technical Analysis For Dummies, and my biggest takeaway is pretty simple:
It gives you a lot of the basics, but it is not going to hand you a complete trading system or everything you need to consistently make money trading the stock market.
That does not make it a bad trading book. It just means you need to understand what you’re actually buying.
Quick Answer: What Is the Best Way to Learn Technical Analysis?
The best way to learn technical analysis is to combine structured learning with actual chart study and backtesting. A beginner book like Technical Analysis For Dummies by Barbara Rockefeller can teach you what indicators, candlestick patterns, trends, moving averages, stock price charts and support and resistance actually mean. From there, you still need to spend time looking at real charts, testing setups, collecting data, and learning how different indicators behave under different market conditions.
Learn the Basics of Technical Analysis
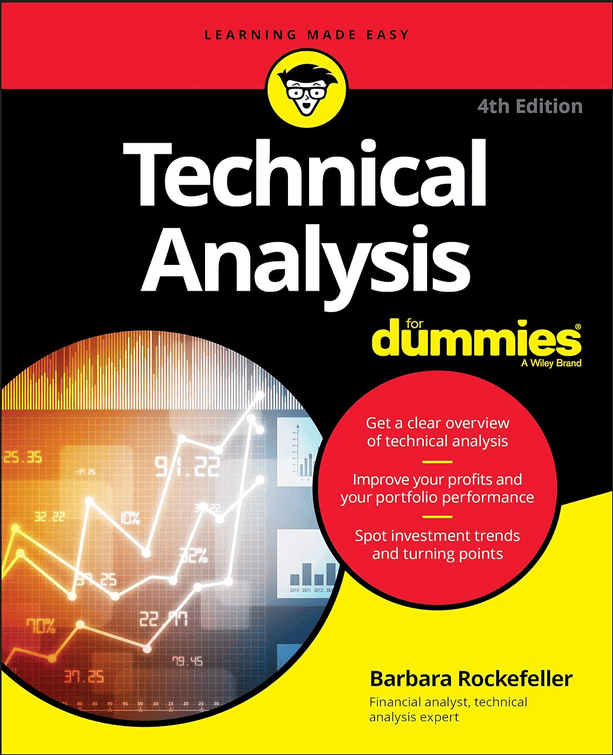
Technical Analysis For Dummies covers chart patterns, indicators, moving averages, candlesticks, trends, and other core technical analysis concepts for beginners.
$29.99 on Amazon
View on AmazonThe Good: It Covers a Lot of the Basics
The strongest part of Technical Analysis For Dummies is the sheer range of introductory material it covers.
You’ll learn about different types of price charts and candlesticks, moving averages, trendlines, support and resistance, momentum, volatility, volume, and common technical indicators.
That breadth of the book makes it especially useful if you’ve ever opened a charting platform and wondered what half of the available tools actually do.
It also does a decent job of explaining technical analysis without assuming that you already understand a bunch of trader terminology.
When I read Technical Analysis For Dummies, I found it useful primarily as a foundational book. It helps you understand what traders mean when they talk about things like moving averages, candlestick formations, trends, breakouts, and momentum.
That knowledge matters because it gives you a language for understanding markets.
What the book does NOT do is magically turn those concepts into a profitable strategy.
The Bad: Knowing Indicators Isn’t the Same as Having a Strategy
This is where I think beginners need to keep their expectations realistic.
Reading Technical Analysis For Dummies can teach you what a moving average crossover is or how traders interpret different candlestick formations.
That does not automatically tell you whether a particular setup has a positive expectancy.
You could understand every indicator in the book and still lose money if you do not have defined entry rules, exit rules, risk management, position sizing, and enough backtesting to know whether your strategy has actually worked over a meaningful sample size.
That is one of the biggest lessons I’ve learned from studying trading systems myself. Technical analysis tools are just ingredients. A profitable trading strategy is the recipe.
A Good Starting Point, Not a Finished Trading System
I think Technical Analysis For Dummies works best as a foundation. Learn the terminology and tools first, then start testing which combinations of indicators, price action, and trading rules actually produce measurable results.
The book is currently listed at $29.99 on Amazon.
Check Technical Analysis For Dummies on AmazonThe Ugly: Technical Analysis Can Be Very Subjective
One weakness of technical analysis in general is that it is incredibly easy to look at a chart after the fact and find a pattern that appears obvious.
Two traders can sometimes look at the exact same chart and draw different trendlines, identify different support levels, or interpret the same candlestick differently.
That is why my own approach has increasingly focused on defining specific trading rules and then testing those rules over a large sample size.
Technical Analysis For Dummies can show you the tools that you and other traders can use. But your job is figuring out which tools actually have value within the strategy you’re trying to trade.
That distinction matters.
You do not want to get trapped constantly adding another indicator because it looked useful on the last chart you studied. At some point, technical analysis needs to turn into something measurable.
Is Technical Analysis For Dummies Worth Reading?
For a beginner, yes, I think Technical Analysis For Dummies can absolutely be worth reading.
It gives you enough knowledge to understand technical analysis terminology and begin experimenting with charts intelligently.
It can also help you make sense of a lot of trading content online because you’ll understand what people mean when they reference moving averages, candlestick patterns, momentum, resistance levels, breakouts, and other common concepts.
Just don’t treat the book as a shortcut to profitability.
The best use of Technical Analysis For Dummies is to learn the foundation, then build on it with chart study, paper trading, data collection, and proper backtesting.
Build Your Technical Analysis Foundation
If you’re still learning how candlesticks, moving averages, momentum indicators, trends, and chart patterns work, Technical Analysis For Dummies can help fill in the gaps before you begin building and backtesting your own strategy.
$29.99 on Amazon
Buy Technical Analysis For Dummies on Amazon


If you want to go deeper:
- Explore the Trading Statistics Hub to understand how different sectors behave across market cycles
- Study real setups inside the Trade Reviews section
- Learn the framework behind high-probability setups in the Post-Earnings Momentum Strategy
This is how you turn raw market data into repeatable trading edge.
More Trading Statistics…


Technical Analysis For Dummies FAQ
Can you explain technical analysis in a simple way?
Technical analysis is the study of price, volume, trends, and other market data to look for patterns that may help traders estimate what could happen next.
Instead of focusing primarily on a company’s revenue, earnings, or valuation, technical traders usually focus more heavily on what the stock’s price and trading activity are doing.
What is the best way to learn technical analysis?
Start by learning the fundamentals through a structured resource such as Technical Analysis For Dummies, then apply those concepts to real charts.
From there, define specific trading rules and backtest them across a meaningful sample of trades rather than assuming an indicator works simply because it looks good on a chart.
What are some examples of technical analysis?
Common examples of technical analysis include moving averages, candlestick patterns, support and resistance, trendlines, RSI, MACD, Bollinger Bands, volume analysis, momentum indicators, and breakout patterns.
How can a beginner analyze stocks?
A beginner can start by identifying the overall trend, marking important support and resistance levels, reviewing volume, and watching how price behaves around moving averages or previous highs and lows.
The important part is avoiding indicator overload. Start with a few concepts you understand and learn how they behave before adding more.
Does Technical Analysis For Dummies teach you how to trade?
Technical Analysis For Dummies teaches many of the concepts used by technical traders, but I would not consider it a complete trading system.
You’ll still need rules for entries, exits, position sizing, risk management, and trade selection, ideally supported by your own backtesting.
Is Technical Analysis For Dummies good for beginners?
Yes. I think Technical Analysis For Dummies is best suited to beginners who want to understand the basic tools and terminology used in technical analysis.
More experienced traders who already understand indicators, chart patterns, moving averages, and support and resistance may find a lot of the material fairly basic.
Is technical analysis enough to become profitable?
Not by itself.
Technical analysis can help you identify and define trading setups, but profitability also depends on risk management, execution, position sizing, discipline, market conditions, and whether your strategy actually has positive expectancy.
That is why I think technical analysis should be paired with structured backtesting rather than treated as a standalone answer to making money in the market.


Leave a Reply