

In this review, I break down what Stock Trading & Investing Using Volume Price Analysis does well, where it falls short, and whether it is actually worth adding to your trading library. You’ll learn why its 200+ annotated chart examples are useful for building pattern-recognition skills, why the repetition can become a weakness, how the book influenced the way I think about post-earnings momentum research, and how it compares with other trading books.

Anna Coulling’s Stock Trading & Investing Using Volume Price Analysis is one of those trading books that does one thing over and over again until the concept is almost impossible to ignore.
The basic idea is simple: price tells you what happened, while volume can provide context about how meaningful that move might be. Coulling reinforces that idea using hundreds of annotated stock charts showing different combinations of price action and volume.
I will say that this is a good book that reinforces the importance of pattern recognition and the overall understanding volume as a driver of price action.
And while enjoyed the book, I also think its biggest strength is simultaneously its biggest weakness…
Below, I’ll explain what I mean by this, why I think this is a good addition to any trader or investor‘s book shelf, and also why it’s not going to make you into a consistently profitable trader on its own.
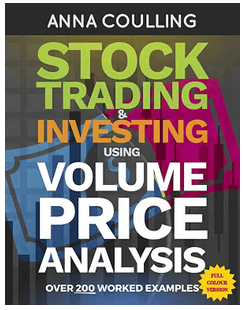
Stock Trading & Investing Using Volume Price Analysis
✓ Strong for pattern recognition
✓ Easy-to-understand volume concepts
✗ Not a complete trading strategy
✗ Heavy reliance on chart examples
What I Liked About Volume Price Analysis
The best thing about Stock Trading & Investing Using Volume Price Analysis is the sheer number of real chart examples.
Instead of spending 300 pages explaining theoretical trading concepts, Coulling repeatedly puts charts in front of you and points out what is happening with price and volume.
You see breakouts, reversals, accumulation, selling pressure, changes in volume and plenty of examples where price and volume appear to confirm one another.
After a while, you start recognizing the patterns before reading the annotations. That actually ended up being more valuable to me than any individual volume rule in the book.
One of the biggest lessons I took away was the importance of pattern recognition through repetition.
Looking at five charts might teach you a concept. Looking at 200 charts starts training your brain to notice similarities between completely different stocks and market environments.
Pros of Stock Trading & Investing Using Volume Price Analysis
Tons of annotated charts reinforce the core concepts.
Repetition helps train your eye to spot recurring market behaviour.
Volume and price relationships are explained without unnecessary complexity.
Less theory, more visual examples of how price and volume interact.
The examples can help traders develop hypotheses worth testing with data.
Especially useful if you’re still learning how to interpret price action.
It gets you studying market behaviour instead of blindly following indicators.
The concepts can apply to day trading, swing trading, and investing.
If you’re interested in volume, price action, and learning through hundreds of real chart examples, this is a solid book to add to your trading library.
View the Book on Amazon →That lesson has carried directly into the post-earnings momentum research I do today.
I’ve now spent an absurd amount of time reviewing post-earnings stock charts, recording first-hour moves, maximum favorable excursion, maximum adverse excursion, breakouts and next-day performance.
In a weird way, this book helped plant the seed for that approach.
The charts themselves didn’t give me a trading strategy. But they helped convince me that studying hundreds of similar market events could eventually reveal recurring behaviour worth measuring.
Where the Book Falls Short
The biggest criticism is pretty obvious once you’ve read half the book. There are a lot of charts showing essentially the same thing.
That repetition is useful, but it can also become tedious. There were points where I felt like I understood the lesson 50 charts ago and didn’t necessarily need another 50 examples reinforcing it.
More importantly, reading hundreds of annotated charts isn’t the same thing as developing a profitable trading strategy.
The book can help you recognize relationships between volume and price, but it doesn’t magically solve questions like when to enter trades, where to exit, how much you should be risking, or how to find repeatable edge.
Cons of Stock Trading & Investing Using Volume Price Analysis
Many charts reinforce essentially the same volume and price concepts.
It doesn’t give you a fully defined entry, exit, and risk-management framework.
The examples are visual, but they don’t tell you how often each setup actually works.
Annotated charts can look obvious after the move has already happened.
Once the core lesson clicks, some sections can feel longer than necessary.
Pattern recognition is useful, but traders still need to test ideas with real data.
Experienced chart readers may find some of the repeated explanations too basic.
At around $60, it’s not the cheapest addition to a trading bookshelf.
I wouldn’t buy this expecting a ready-made trading strategy. But if you want to improve your chart reading and pattern recognition, there’s still a lot of value here.
See the Book on Amazon →Those questions require testing. That’s probably my biggest takeaway after doing more of my own trading research.
Pattern recognition is excellent for generating hypotheses. Data is what tells you whether those hypotheses actually hold up.
How It Compares With Other Trading Books
This is also why I think Volume Price Analysis complements other trading books better than it replaces them.
One Good Trade focuses much more heavily on the process of becoming a trader, including preparation, discipline, reviewing trades and developing an edge.
The Little Book of Valuation comes from almost the opposite direction. It focuses much more on what a business may actually be worth, making it useful for investors who want to understand fundamentals alongside charts.
Then you have books like The Complete Penny Stock Course, which concentrate more specifically on trading smaller, volatile stocks and the mechanics surrounding that niche.
Coulling’s book fits nicely between those approaches.
It isn’t really a complete trading system, investing framework or trading psychology book. But it’s still a great book about learning to look at markets differently.
Want to Get Better at Reading Price and Volume?
If you learn best by studying real charts, this is one of the better trading books to keep on your shelf. You get more than 200 worked examples, repeated exposure to volume-price relationships, and a strong foundation for developing better pattern recognition.
Is Stock Trading & Investing Using Volume Price Analysis Worth Reading?
I think so, particularly if you’re still developing your ability to read charts. Just don’t expect to finish it with a fully formed trading strategy.
For me, the real value wasn’t discovering some secret volume signal. It was realizing how useful it can be to study large numbers of similar charts, look for recurring characteristics and then ask whether those patterns can actually be quantified.
That mindset eventually became a major part of how I research post-earnings momentum today.
So yes, Stock Trading & Investing Using Volume Price Analysis earns a place on my bookshelf.
It can get repetitive, and I’d never recommend building a strategy purely from its annotated examples, but it’s a very solid addition to a trading and investing literature collection, especially for anyone interested in price action, volume and pattern recognition.


Leave a Reply