

Fastly (FSLY) plunged 16.89% following its November 4, 2026 earnings announcement, despite beating EPS estimates by 21.43%, growing revenue 20.21% year over year, and issuing above-consensus guidance. Using Paper Trading Journal’s Post-Earnings Momentum (PEM) strategy, a hypothetical short entry at the close of the first hourly earnings candle produced a 12.91% maximum favorable excursion (MFE) and a 12.05% next-day closing gain. However, the setup also experienced a 6.75% adverse reversal, demonstrating how tighter stop losses could eliminate otherwise profitable trades before momentum resumes.

Fastly (NYSE: FSLY) is a technology company specializing in edge cloud computing, content delivery, cybersecurity, and application performance.
With a market capitalization of approximately $3.35 billion and 13.65% short interest, Fastly entered its November 2026 earnings announcement with considerable potential for volatility.
Following its November 4 earnings release, FSLY plunged 16.89% during its first hourly earnings candle. That’s a particularly strong move, especially since, as we’ll see below the company actually reported fairly optimistic numbers across the board.
Despite a temporary reversal, the bearish momentum eventually resumed, producing a 12.05% hypothetical gain using the close of the hourly earnings candle as our entry and a next-day EOD exit.
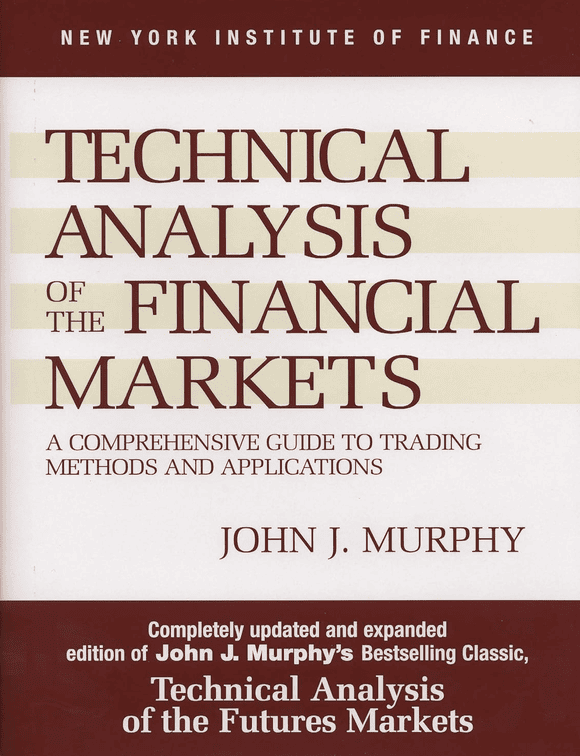
Learn the Fundamentals of Technical Analysis
John J. Murphy’s Technical Analysis of the Financial Markets covers charts, trends, indicators, candlesticks, intermarket relationships, and other core technical analysis concepts.
Price: $34.27–$35.50
View on Amazon →Earnings Results & Fundamentals
Fastly reported third-quarter 2026 earnings on November 4, exceeding Wall Street expectations for both revenue and earnings per share (EPS).
FSLY Q3 2026 Earnings Results
Overall, Fastly delivered strong earnings growth, modestly exceeded revenue expectations, and issued better-than-expected fourth-quarter guidance.
However, despite these positive fundamentals, investors responded by aggressively selling FSLY shares. That divergence between earnings results and market reaction reinforces an important PEM principle:
Strong fundamentals do not necessarily translate into bullish short-term price action. Which is exactly what we saw after FSLY reported, the stock broke down through hourly support, retrace towards its 6-9-12 EMA cloud, and the produced a +12.05% intraday trade opportunity.
PEM Technical Analysis & Trade Outcome
Following its earnings announcement, FSLY declined 16.89% during the first hourly earnings candle, establishing a strong-looking bearish post-earnings momentum setup.
The stock broke below its hourly trading structure but failed to confirm a breakout on either the four-hour or daily timeframe, resulting in a breakout score of just 1 out of 3.

Nevertheless, the initial bearish momentum eventually continued into the following trading session.
Using the close of the first hourly earnings candle as the hypothetical short entry, FSLY produced the following results:
FSLY Post-Earnings Momentum Results
Results assume a hypothetical short entry at the close of the first hourly earnings candle and an exit at the following session’s closing price, with a 15% catastrophic stop loss. Returns exclude trading fees, slippage, and short-borrowing costs.
Importantly, FSLY did not immediately continue lower after the initial earnings-driven decline.
Instead, shares temporarily recovered, retraced back towards their moving averages, and produced a 6.75% adverse excursion against the hypothetical short entry at the close of the hourly earnings candle.
That means, had a trader been using the close of the hourly earnings candle as their entry, their trade would have experienced a -6.75% drawdown before continuing lower and moving in the direction of the initial breakdown.

That said, if a trade had a stop loss placed outside of the adverse range, their trade would have survived until the end of the trading session, and recorded a +12.05 EOD gain.

On the other hand, the only real weakness this setup had was the absence of a four-hour and daily breakout confirmation.
We often prefer seeing setups that breakout on at least 2 or more timeframes. Yet even hough FSLY lacked multiple timeframe confirmation, the initial hourly momentum was sufficient to produce a substantial next-day directional move with relatively minor adverse price action.

Learn the Fundamentals of Technical Analysis
John J. Murphy’s Technical Analysis of the Financial Markets covers charts, trends, indicators, candlesticks, intermarket relationships, and other core technical analysis concepts.
Price: $34.27–$35.50
View on Amazon →Conclusion
Fastly’s November 2026 earnings reaction demonstrates how powerful post-earnings momentum can be, even when the underlying company reports better-than-expected financial results.
Despite beating earnings expectations and raising its outlook above consensus, the stock declined sharply, temporarily reversed, and ultimately continued lower.
For traders following the PEM framework, the most important lesson isn’t simply that the trade generated a 12.05% return.
It’s that a tighter stop loss could have eliminated the position before the profitable move developed.
In the end, this case study reinforces two recurring observations from PTJ’s historical research: earnings fundamentals don’t always predict price direction, and temporary adverse price movements don’t necessarily invalidate an otherwise profitable momentum setup.
If you want to go deeper:
- Explore the Trading Statistics Hub to understand how different sectors behave across market cycles
- Study real setups inside the Trade Reviews section
- Learn the framework behind high-probability setups in the Post-Earnings Momentum Strategy
This is how you turn raw market data into repeatable trading edge.


Leave a Reply