

Stock market corrections don’t always lead to bear markets, and heightened volatility can create opportunities for short-term traders. Historical Nasdaq-100 data shows that 73.7% of corrections avoided a 20% bear market decline, while 26.3% developed into bear markets. Meanwhile, research on VIX spikes above 30 found positive 12-month S&P 500 returns in 66.7% of cases, with a median gain of 15.1%. But for post-earnings momentum (PEM) traders, broader market direction isn’t necessarily the deciding factor. Our PEM research has identified approximately 12% average maximum favorable excursions (MFE) across bullish and bearish setups, while recent IDXX and LITE case studies produced hypothetical next-day EOD gains of 16.80% and 17.28%, respectively.

The Nasdaq Composite has officially entered correction territory, falling more than 10% from its October 6, 2026, record high. Meanwhile, the CBOE Volatility Index (VIX) surged nearly 70% in a single session, closing November 5 at 28.18.
Adding to the uncertainty, Democrats have won control of both the House of Representatives and Senate in the 2026 midterm elections, setting the stage for divided government under President Donald Trump.
Between falling stock prices, heightened volatility, and political uncertainty, investors have plenty of reasons to be nervous.
But does a 10% stock market correction mean a bear market is coming? Is buying stocks when the VIX is elevated actually profitable? And how much do Democrats and Republicans influence stock market returns?
Let’s look at the historical statistics before explaining why broader market conditions don’t necessarily determine the success or failure of individual post-earnings momentum (PEM) trades.
Quick Answer: What’s the Difference Between a Stock Market Correction & a Bear Market?
A stock market correction occurs when an index falls 10% or more from a recent high, while a bear market begins after a decline of 20% or more. Conversely, a bull market generally refers to a sustained upward trend, often marked by a 20% rally from a market low. However, broader market direction doesn’t necessarily determine the outcome of individual trades. Our historical post-earnings momentum (PEM) research shows that long and short setups generate approximately 12% average maximum favorable excursions (MFE), demonstrating that substantial trading opportunities can emerge in both rising and falling markets.

Option Volatility and Pricing
A comprehensive guide to options pricing, volatility, trading strategies, and risk management. An excellent resource for traders looking to understand market volatility beyond simply predicting stock direction.
Check Price on Amazon →Affiliate disclosure: We may earn a commission from qualifying purchases at no additional cost to you.
How Often Do Nasdaq Corrections Turn Into Bear Markets?
To answer that question, we can examine historical drawdowns in the Nasdaq-100, using the Invesco QQQ ETF as a proxy. A historical dataset covering March 1999 through October 2026 identified 19 completed drawdown episodes of at least 10%.
Here’s what we get when we calculate how many of those corrections eventually became bear markets.
| Historical Outcome | Occurrences | Percentage |
|---|---|---|
| Declined 10% or more | 19 | 100% |
| Stopped short of a 20% decline | 14 | 73.7% |
| Reached a 20% bear market | 5 | 26.3% |
| Exceeded a 30% decline | 2 | 10.5% |
Sample: 19 completed Nasdaq-100 drawdown episodes of at least 10% (1999–2026). Percentages calculated from historical episode counts.
The takeaway? Nearly three out of every four corrections in this sample stopped short of becoming bear markets.
Furthermore, the 13 corrections that bottomed between 10% and 15% recovered to their previous highs in a median of just 29 calendar days after reaching their lows.
Of course, averages and probabilities don’t eliminate the possibility of an extended downturn.
The dot-com collapse, for example, produced an approximately 83% decline in QQQ, followed by a recovery that lasted nearly 14 years from its bottom.
It’s also important to note that this dataset tracks the Nasdaq-100 rather than the broader Nasdaq Composite, and its historical episodes are not a guarantee of future outcomes.
Nevertheless, the evidence demonstrates an important point: a correction is not automatically a bear market.
The downside to that fact is that, sometimes, market corrections can and do sometimes turn into bear markets or market “crashes.” Which emphasizes the importance of risk management and having a solid understanding of stock market mechanics before trading or investing.
Is Buying Stocks When the VIX Is High a Good Idea?
The VIX measures the stock market’s expected volatility over approximately 30 days, using options prices on the S&P 500.
While many refer to the VIX as a “fear” gauge, it’s not actually measuring fear and it doesn’t predict whether stock prices will rise or fall. Instead, it reflects the magnitude of fluctuations that options traders anticipate, which is also known as volatility.

On November 5, 2026, the VIX jumped from 16.61 to 28.18, an increase of approximately 69.7%.
That’s a substantial increase in expected volatility, but does heightened fear create a buying opportunity?
Historical research suggests that the answer is complicated.
One study examining 21 completed VIX spikes above 30 between 1990 and 2026 produced the following results:
| Metric | Historical Result |
|---|---|
| Completed VIX spike episodes | 21 |
| Positive S&P 500 returns after 12 months | 14 |
| Probability of a positive 12-month return | 66.7% |
| Median 12-month return | +15.1% |
| Average 12-month return | +7.1% |
| Episodes with a further 10%+ decline | 12 |
Sample: 21 completed VIX spike episodes above 30 between 1990 and 2026. Historical returns refer to the S&P 500. Past performance does not guarantee future results.
While the median 12-month return was attractive, approximately 57% of those episodes experienced another decline exceeding 10% from the initial entry level within the following year.
That’s hardly a risk-free buying opportunity. And then, to make matters even more complication, other studies using different sampling methods have produced stronger results.
For example, Cboe research examining daily observations with VIX readings above 30 between 1990 and 2021 found average subsequent one-year S&P 500 returns of approximately 23%.
However, repeated observations during the same volatility episode are not independent trading opportunities.
The lesson? Elevated volatility can create opportunities, but a high VIX isn’t a reliable standalone buy signal.
And with the VIX currently in the high 20s, it’s worth remembering that the strongest historical rebound statistics often come from significantly more extreme volatility readings.
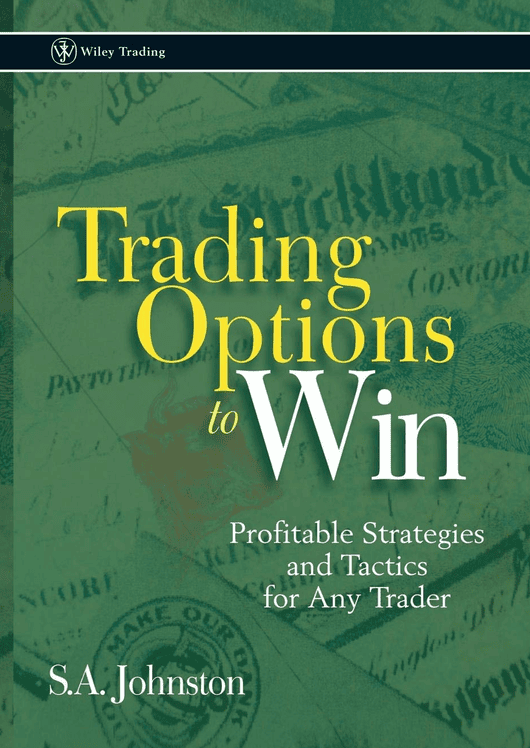
Explore options trading and hedging strategies for managing bullish and bearish market exposure.
View on Amazon →Do Stocks Perform Better Under Democrats or Republicans?
The 2026 midterms have introduced another variable into the stock market equation. Democrats recently won control of both chambers of Congress, while President Trump remains in the White House.
But what does history tell us about stock market performance under different political configurations?
Research from RBC Wealth Management examined average annual S&P 500 price returns under six combinations of presidential and congressional control, using data from 1953 through 2023.
| Government Configuration | Average Annual Return |
|---|---|
| Republican president, Republican Congress | +12.9% |
| Republican president, split Congress | +7.3% |
| Republican president, Democratic Congress | +4.9% |
| Democratic president, Democratic Congress | +8.0% |
| Democratic president, split Congress | +15.7% |
| Democratic president, Republican Congress | +16.3% |
Source: RBC Wealth Management. Historical average annual S&P 500 price returns by presidential party and congressional control, 1953–2023. Figures represent historical associations, not evidence of causation.
Interestingly, the historical configuration most relevant to the incoming Congress—a Republican president alongside a Democratic-controlled Congress—produced the lowest average return in this particular study.
But that doesn’t necessarily mean the market is heading lower. These figures are historical associations, not evidence that one political party causes stronger or weaker stock market performance.
Interest rates, inflation, economic growth, monetary policy, corporate earnings, and valuations all influence investment returns. Some government configurations also have relatively few historical observations.
The most important takeaway is that political control alone isn’t enough to forecast stock market direction.
Option Volatility and Pricing
A comprehensive guide to options pricing, volatility, trading strategies, and risk management. An excellent resource for traders looking to understand market volatility beyond simply predicting stock direction.
Check Price on Amazon →Affiliate disclosure: We may earn a commission from qualifying purchases at no additional cost to you.
Why Day Traders Don’t Care About Bull Markets or Bear Markets
For long-term investors, bull and bear markets can significantly impact portfolio values and overall investment returns. But for short-term day traders and swing traders, heightened market volatility can actually create more trading opportunities.
Day traders often seek volatile stocks capable of producing larger intraday price swings. The greater the price movement, the greater the potential profit, although volatility also increases downside risk.
That’s exactly what our post-earnings momentum (PEM) strategy attempts to capitalize on.
Rather than predicting broader market direction, PEM trading focuses on individual earnings announcements, market expectations, and subsequent price action.
Because setups can be traded both long and short, opportunities exist regardless of whether the Nasdaq is rising or falling.
The bottom line? Bull and bear markets matter, but short-term traders don’t necessarily need a rising market to profit. They need volatility, identifiable setups, and disciplined risk management.
Three recent PEM case studies illustrate this distinction.

Three PEM Case Studies: Why Individual Earnings Reactions Matter
Now, the one thing we need to emphasize is that we’re NOT suggesting that trading is risk-free or that bear markets, corrections, and VIX spikes don’t matter.
Rather, we’re illustrating how PEM setups can produce opportunities in both directions, regardless of broader market trends.
The following case studies demonstrate that seemingly perfect setups can fail and reverse, imperfect setups can deliver remarkable returns, and sometimes straightforward earnings-driven trades simply work as expected.
But ultimately, every setup carries risk, and no outcome is guaranteed. EVER!
SMCI and ANET: When Strong Setups Fail
Super Micro Computer (SMCI) and Arista Networks (ANET) demonstrated why seemingly strong earnings setups can still fail.

Both companies reported encouraging earnings results, guidance, and positive initial price reactions.
Their initial earnings reaction involved SMCI surging more than +8% and ANET surging more than 14% in a single hour.

However, neither the positive results or the price action could sustain the initial bullish move. Both stocks subsequently reversed more than 10% against their initial first-hour closing prices.
Lesson: Even strong earnings and convincing initial momentum cannot eliminate reversal risk. Technical confirmation and risk management still matter.
IDXX: An Imperfect Setup Produces a +16.80% Gain
IDEXX Laboratories (IDXX) provides the opposite example.
The company reported better-than-expected earnings, raised guidance, and the initial earnings reaction supported a bullish trading opportunity.
The only downside is that, based on the setup criteria I often look for, this setup was far from perfect.
For example, while I typically watch for PEM setups that move close to +/-10% in a single hour, IDXX only moved about 4.5% after earnings. Similarly, while I also prefer to see stocks breakout on multiple timeframes, IDXX didn’t produce a clean breakout on either the 1-hour, 4-hour or daily charts.

Despite those imperfections, a long entry at the close of the first hourly earnings candle would have produced a maximum favorable excursion (MFE) of +17.40% and a next-day EOD return of +16.80%
Lesson: Imperfect technical setups like IDXX can still generate substantial gains when earnings expectations, momentum, and price action align.
LITE: Strong Earnings, Bearish Reaction, +17.28% Short Gain
Lumentum (LITE) demonstrated why trading earnings headlines alone can be dangerous. Despite reporting strong earnings and issuing revenue and EPS guidance above analyst expectations, the stock initially sold off.
The bearish price action continued through the following trading session, producing a hypothetical +17.28% next-day EOD short-selling return under the case study’s entry and exit assumptions.

The important factor wasn’t whether the earnings report looked impressive on paper. It was how the stock reacted relative to what investors had already priced in.
This is a strong company. They reported strong EPS and revenue results and strong forward guidance. And yet… the stock sold off more than -17% from the close of the hourly earnings candle to the low-of-day.
Lesson: Strong fundamentals don’t always translate into bullish price action. Sometimes the better opportunity is on the short side when price is breaking support levels and moving decisively lower after earnings.
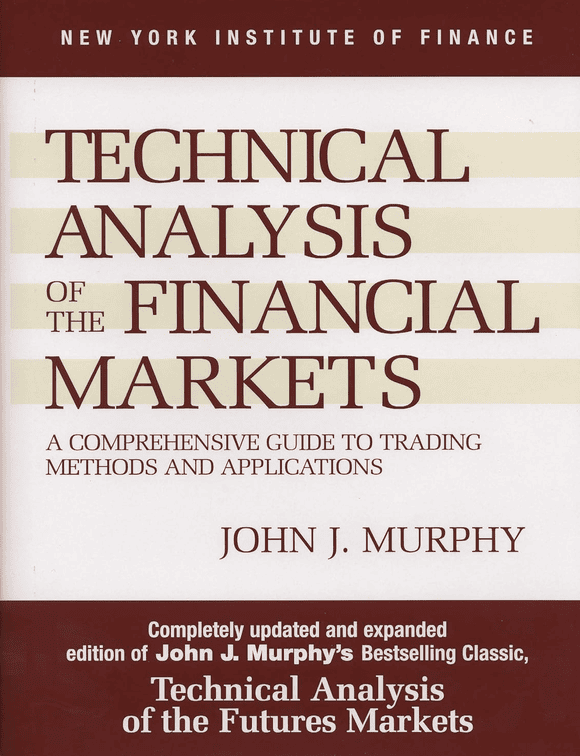
Learn the Fundamentals of Technical Analysis
John J. Murphy’s Technical Analysis of the Financial Markets covers charts, trends, indicators, candlesticks, intermarket relationships, and other core technical analysis concepts.
Price: $34.27–$35.50
View on Amazon →Conclusion: Market Direction Matters Less Than Your Trading Setup
The Nasdaq has entered correction territory, the VIX has spiked, and political uncertainty has increased following the 2026 midterm elections.
But none of those developments guarantees a bear market is coming.
Historical data shows that many Nasdaq-100 corrections recover without turning into bear markets, elevated volatility doesn’t automatically create a profitable entry point, and political control is an unreliable standalone indicator of future stock returns.
For post-earnings momentum traders, the objective isn’t to predict the next bull or bear market. It’s simply to identify earnings-driven price movements, evaluate technical confirmation, manage risk, and execute a consistent trading strategy.
You don’t need to know where the Nasdaq is going next to identify an individual stock trading opportunity.
Option Volatility and Pricing
A comprehensive guide to options pricing, volatility, trading strategies, and risk management. An excellent resource for traders looking to understand market volatility beyond simply predicting stock direction.
Check Price on Amazon →Affiliate disclosure: We may earn a commission from qualifying purchases at no additional cost to you.
If you want to go deeper:
- Explore the Trading Statistics Hub to understand how different sectors behave across market cycles
- Study real setups inside the Trade Reviews section
- Learn the framework behind high-probability setups in the Post-Earnings Momentum Strategy
This is how you turn raw market data into repeatable trading edge.


Frequently Asked Questions (FAQ)
1. What is considered a stock market correction?
A stock market correction occurs when a major index, such as the S&P 500 or Nasdaq Composite, declines 10% or more from a recent high. Corrections are a normal part of market cycles and don’t necessarily indicate that a prolonged bear market is coming.
2. What is the difference between a correction and a bear market?
The main difference is the magnitude of the decline. A correction generally involves a 10% decline, while a bear market is defined by a drop of 20% or more from a recent peak. Bear markets are typically more severe and can take considerably longer to recover from.
3. How often do stock market corrections turn into bear markets?
Historical Nasdaq-100 drawdown research covering 19 completed corrections between 1999 and 2026 found that 26.3% developed into bear markets, while 73.7% stopped short of a 20% decline. These figures are specific to the Nasdaq-100 sample and don’t guarantee future results.
4. Is it a good idea to buy stocks during a market correction?
Buying stocks during corrections can create attractive long-term investment opportunities, particularly when quality companies are trading at lower valuations. However, there’s no guarantee prices won’t continue falling. Investors should consider their investment horizon, risk tolerance, and financial circumstances rather than assuming every 10% decline is a buying opportunity.
5. What does it mean when the VIX spikes?
A rising CBOE Volatility Index (VIX) indicates that options markets are pricing in larger expected S&P 500 price fluctuations over the next 30 days. Although the VIX is commonly called the fear index, it measures expected volatility rather than predicting whether stocks will rise or fall.
6. Is buying stocks when the VIX is high profitable?
Historically, periods of elevated VIX readings have sometimes preceded strong stock market recoveries. However, higher volatility also increases downside risk. In one study of 21 VIX spike episodes above 30, 66.7% produced positive S&P 500 returns after 12 months, while 12 episodes experienced an additional decline exceeding 10%.
7. Does the stock market perform better under Democrats or Republicans?
Historical S&P 500 returns have varied under both Democratic and Republican leadership. Research also shows differences between unified and divided governments. However, neither political party consistently guarantees stronger stock market performance, and economic conditions, corporate earnings, monetary policy, and valuations generally provide more useful context than political affiliation alone.
8. Do day traders make more money during bear markets?
Not necessarily. Bear markets often create larger price swings and increased volatility, which can provide opportunities for experienced day traders and short sellers. However, greater volatility increases both potential profits and potential losses. Trading profitability ultimately depends on execution, strategy, transaction costs, and risk management.
9. Can you make money trading stocks when the market is falling?
Yes. Traders can potentially profit during falling markets through short selling, put options, and other bearish strategies. Post-earnings momentum trading can also identify stocks experiencing significant declines following earnings announcements. However, bearish trading strategies carry substantial risks, including potentially unlimited losses when short selling.
10. Does a bull or bear market affect post-earnings momentum trading?
Broader market trends can influence liquidity, investor sentiment, volatility, and individual stock reactions. However, PEM trading focuses primarily on market expectations, earnings results, guidance, and subsequent price action. Because the strategy examines both bullish and bearish setups, potential trading opportunities can emerge during bull markets, bear markets, and corrections.
11. How profitable are post-earnings momentum setups?
Our historical PEM research has identified approximately 12% average maximum favorable excursions (MFE) across bullish and bearish setups. However, MFE represents the largest favorable price movement during the measurement period, not the profit a trader necessarily captures. Actual returns depend on entries, exits, slippage, fees, and risk management.
12. Can strong earnings cause a stock to fall?
Absolutely. Stock prices react to expectations, not simply whether reported earnings appear positive. A company can beat analyst earnings estimates but still sell off because of disappointing guidance, elevated valuations, profit-taking, or results that fail to meet investors’ expectations. Our Lumentum (LITE) case study illustrates how strong reported earnings can coincide with a profitable hypothetical bearish PEM setup.
13. Are volatile stocks better for day trading?
Volatile stocks can offer larger intraday price movements, creating opportunities for short-term traders. However, increased volatility also brings greater risk, wider spreads, potential slippage, and faster reversals. Volatility creates opportunity, but doesn’t automatically create a trading advantage.
14. Can a perfect trading setup still fail?
Yes. Even setups with strong earnings, encouraging guidance, and convincing initial momentum can reverse unexpectedly. Our SMCI and ANET case studies demonstrate how apparently attractive post-earnings setups can experience reversals exceeding 10%. No combination of technical indicators or fundamental results guarantees a profitable trade.
15. Should day traders avoid trading during stock market corrections?
Not necessarily. Corrections can generate substantial price swings, particularly in stocks reacting to earnings announcements. Rather than avoiding all trading activity, traders can focus on identifying valid setups, evaluating market conditions, adjusting position sizes when appropriate, and managing downside risk. The objective isn’t to predict the next bull market but to execute a repeatable strategy with a measurable statistical edge.
References
Exent. (2026, October 30). What happens to stocks after the VIX spikes above 30? https://www.exent.ai/resources/stock-market-after-vix-spikes-above-30
Hickle, S., & Humphries, J. (2022, July 15). Embracing and harnessing volatility: Feeling confident in your strategy. Cboe Global Markets. https://www.cboe.com/insights/posts/embracing-and-harnessing-volatility-feeling-confident-in-your-strategy
Laforest, J. (2026, November 3). IDXX case study: How to capture a 16.80% gain without timing the top. The Paper Trading Journal. https://papertradingjournal.com/2026/11/03/idxx-case-study/
Laforest, J. (2026, November 3). LITE case study: Strong earnings + bearish signals = a +17.28% EOD gain. The Paper Trading Journal. https://papertradingjournal.com/2026/11/03/lite-case-study/
Laforest, J. (2026, November 5). SMCI & ANET case study: When good post-earnings momentum setups go bad. The Paper Trading Journal. https://papertradingjournal.com/2026/11/05/smci-and-anet-reversal-case-studies/
Laforest, J. (n.d.). Post-earnings momentum database. The Paper Trading Journal. https://papertradingjournal.com/post-earnings-momentum-database/
RBC Wealth Management. (2024). Key things to know about U.S. elections. https://www.rbcwealthmanagement.com/en-asia/insights/key-things-to-know-about-us-elections
Shibui Finance. (2026, November 5). Every Nasdaq-100 drawdown since 1999. https://shibui.finance/nasdaq-100-drawdown-history


Leave a Reply