

In this article, you’ll learn how much day traders can realistically make per day, why percentage returns matter more than dollar-based profits, and how technical analysis, profit targets, and stop-losses influence trading performance. We’ll examine historical Dow Jones data, compare real SPOT and LRCX trades that generated 7.88% and 7.82% maximum favorable excursions, and demonstrate how a 1% profit target can produce vastly different dollar returns depending on position size.

Day trading can generate profits ranging from a few dollars to thousands per trade, but determining how much most day traders actually make in a day is far more complicated than comparing dollar amounts.
Think about it like this…
A trader earning $100 on a $1,000 position might be outperforming another trader who earns $500 on a $20,000 position.
Despite making five times less money, the first trader achieved a significantly higher percentage return.
The same principle applies to stock market movements. A 300-point decline in the Dow Jones Industrial Average can represent a devastating trading session or a relatively insignificant pullback, depending entirely on the index’s underlying value.
In this article, we’ll explore how much day traders can realistically make, why measuring profits in dollars can be misleading, and how historical market data and real-world trading examples demonstrate why percentages are often a much better measure of trading performance.
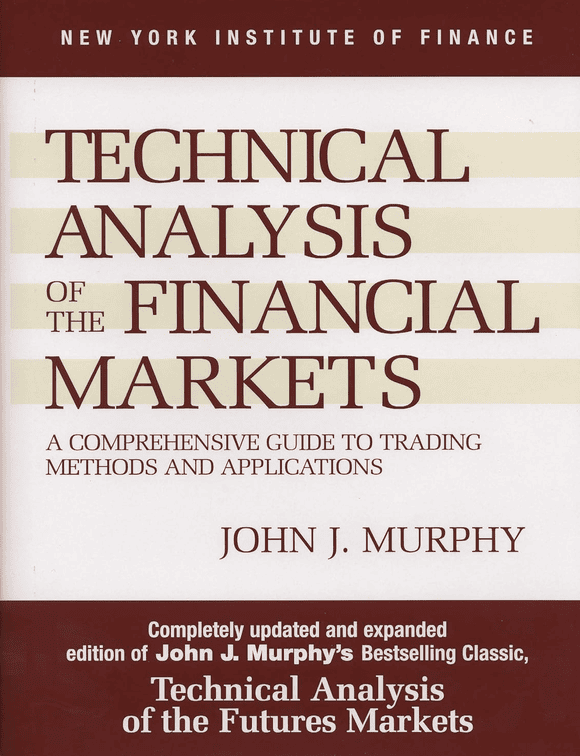
Learn the Fundamentals of Technical Analysis
John J. Murphy’s Technical Analysis of the Financial Markets covers charts, trends, indicators, candlesticks, intermarket relationships, and other core technical analysis concepts.
Price: $34.27–$35.50
View on Amazon →Quick Answer: How Much Do Most Day Traders Make a Day?
There is no universal dollar amount that most day traders make per day, as profitability depends on strategy, position size, profit targets, stop-losses, and trading costs. In fact, trading and market research consistently shows that most retail day traders lose money. However, comparing performance in percentages rather than dollars provides a more meaningful picture. For example, Paper Trading Journal’s post-earnings momentum case studies of Spotify (SPOT) and Lam Research (LRCX) recorded nearly identical maximum favorable excursions (MFE) of 7.88% and 7.82%, respectively, despite substantially different dollar-per-share price movements. Similarly, a trader capturing a 1% gain on a $1,000 position earns $10, while the same return on a $10,000 position generates $100. Ultimately, how much a day trader makes matters less than their ability to consistently generate positive percentage returns while managing risk.
Bigger Profit Targets Don’t Always Mean Bigger Profits
Two hypothetical strategies with different profit targets, stop-losses, and win rates.
| Metric | Strategy A | Strategy B |
|---|---|---|
| Profit Target | +1% | +3% |
| Stop-Loss | −1% | −2% |
| Win Rate | 65% | 35% |
| Expected Return / Trade | +0.30% | −0.25% |
Key Takeaway: Strategy B targets 3× larger percentage gains, yet has negative expectancy. Strategy A, with its smaller 1% target, produces a positive expected return because of its higher win rate.
Note: Hypothetical results before commissions, fees, and slippage. Calculations assume fixed $1,000 positions, full target/stop executions, and no compounding. Expected outcomes are not guaranteed.
PTJ’s Risk-to-Reward Calculator
Use the Risk-to-Reward Calculator below to evaluate the potential profitability and risk of any trading setup. Simply select your trade direction (long or short), enter your position size, entry price, stop-loss, and profit target. The calculator will automatically determine your potential percentage gain or loss, dollar-based profit and risk, risk-to-reward ratio, and minimum breakeven win rate. Experiment with different profit targets and stop-loss levels to see how adjusting your strategy affects the returns needed to remain profitable.
Enter your trade setup to calculate your risk, potential reward, risk-to-reward ratio, position exposure, and breakeven win rate.
Why Dollar Values Can Be Misleading in Trading
Financial headlines often emphasize point-based market movements, such as "Dow Jones plunges 300 points." While these headlines sound dramatic, a 300-point decline means very little without knowing the index's value at the time.
For example, on November 30, 2001, the Dow Jones Industrial Average closed at 9,851.56 points. At that level, a hypothetical 300-point decline would have represented a 3.05% loss—a substantial single-day selloff.
Fast-forward nearly 25 years to October 26, 2026, when the Dow closed at 52,361.58 points. At that considerably higher level, the same 300-point decline would represent a loss of just 0.57%.
In other words, the exact same 300-point decline would have been more than five times as significant in percentage terms in 2001 than in 2026.
This is precisely why traders and investors should evaluate price movements using percentages rather than relying exclusively on absolute dollar or point changes.
Percentages remove the underlying price level from the comparison, making it easier to evaluate performance across different securities and time periods.

Build a Smarter Trading Strategy
Looking to improve your trading knowledge? Explore this book as you work toward developing a more disciplined, consistent approach to trading.
View Book on Amazon →Same 300-Point Loss. Very Different Impact.
How a hypothetical 300-point Dow Jones decline compares at two actual historical index levels.
Key Takeaway: Point changes alone don't tell the whole story. A 300-point Dow decline represents a 3.05% loss at 9,851.56, but only 0.57% at 52,361.58. Percentage changes provide the more meaningful comparison.
Sources: Dow Jones Industrial Average historical closing levels, November 30, 2001 and October 26, 2026. Percentage declines are hypothetical, calculated as 300 divided by the respective index level. Bars are proportional to the percentage declines.
Why Traders Should Use Percentage-Based Profit Targets
Using percentage-based profit targets and stop-losses allows traders to apply consistent strategy parameters across stocks with different share prices.
For example, a 5% profit target represents a $2.50 move on a $50 stock, a $10 move on a $200 stock, and a $25 move on a $500 stock. Although the dollar-based price changes differ significantly, the percentage return is identical.
The same principle applies to risk management.
A trader using a +5% profit target and −2% stop-loss maintains a potential 2.5:1 reward-to-risk ratio regardless of the stock's price. This makes it easier to standardize trading rules, compare historical results, and backtest strategies across different securities.
Percentage-based targets eliminate share-price differences from performance comparisons, allowing traders to focus on relative price movements rather than arbitrary dollar-per-share changes.
However, actual profitability still depends on factors such as win rates, position sizing, execution costs, and whether historical price movements support the chosen targets.
One Strategy. Three Different Stock Prices.
Applying identical percentage-based profit targets and stop-losses across stocks with different prices.
| Stock Price | +5% Target | −2% Stop |
|---|---|---|
| $50.00 | +$2.50 | −$1.00 |
| $200.00 | +$10.00 | −$4.00 |
| $500.00 | +$25.00 | −$10.00 |
Identical percentage returns produce identical dollar outcomes when position sizes are equal.
Key Takeaway: A +5% profit target and −2% stop-loss maintain the same potential 2.5:1 reward-to-risk ratio whether a stock trades at $50, $200, or $500. Percentage-based targets make trading rules comparable across different share prices.
Illustrative long-trade examples. Dollar returns assume $1,000 notional positions, fractional shares where needed, and execution at the specified target or stop price. Excludes commissions, slippage, and other trading costs.
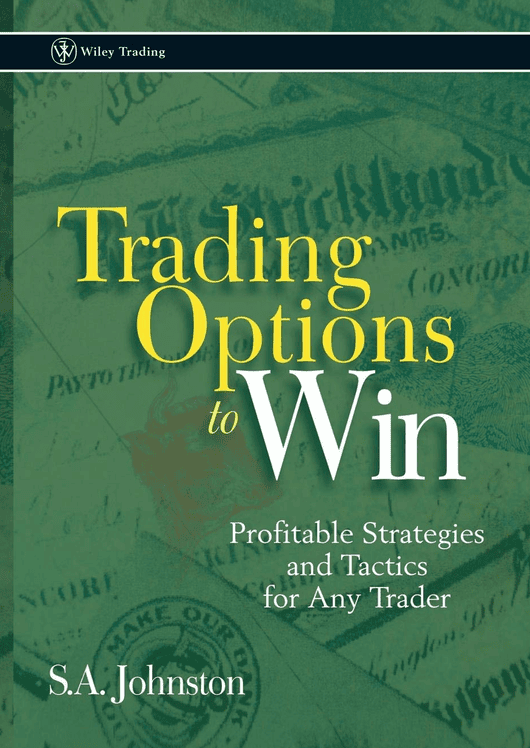
Explore options trading and hedging strategies for managing bullish and bearish market exposure.
View on Amazon →Real Trading Examples: SPOT vs. LRCX
Two of our recent post-earnings momentum case studies demonstrate why percentage-based profit targets are more consistent than fixed-dollar-per-share targets, especially when comparing stocks trading at different prices.
Following their October 2026 earnings announcements, Spotify (SPOT) and Lam Research (LRCX) generated nearly identical maximum favorable excursions (MFE) of +7.88% and +7.82%, respectively.
SPOT was a bullish trade, while LRCX was a bearish short setup, but both results were measured from the close of the initial hourly earnings candle to the high or low of day, which standardizes the MFE reading.

The main difference between the two setups, however, was their dollar-per-share movement.
Using illustrative entry prices of $570 for SPOT and $260 for LRCX, those percentage moves translate to approximately $44.92 and $20.33 per share, respectively.
A trader targeting a fixed $30-per-share profit could have reached that threshold on SPOT, but not LRCX, despite their nearly identical percentage performance.

Meanwhile, a trader using a +7% profit target could theoretically have reached the target on both setups. On identical $1,000 positions, a 7% realized gain would produce the same $70 gross profit, regardless of the underlying share price.
These examples demonstrate why percentage-based trading rules provide a more standardized way to evaluate opportunities across different securities.
Learn the Fundamentals of Technical Analysis
John J. Murphy's Technical Analysis of the Financial Markets covers charts, trends, indicators, candlesticks, intermarket relationships, and other core technical analysis concepts.
Price: $34.27–$35.50
View on Amazon →SPOT vs. LRCX: Nearly Identical Percentage Moves
October 2026 post-earnings momentum case studies
| Metric | SPOT | LRCX |
|---|---|---|
| Trade Direction | Long | Short |
| Example Entry Price | $570 | $260 |
| Maximum Favorable Excursion | +7.88% | +7.82% |
| Favorable Price Move | +$44.92 | −$20.33 |
| +$30/Share Target | Reached | Not Reached |
Key Takeaway: A fixed $30-per-share target treats these two trades differently, despite their nearly identical MFE. A +7% profit target standardizes the performance threshold across both stocks.
Source: Paper Trading Journal, October 2026. MFE figures are from the original case studies. Entry prices are illustrative, not verified historical fills. LRCX's favorable price move is downward because it was a short trade. Target attainment is based on maximum excursion, not guaranteed execution. Excludes fees, slippage, and short-selling costs.
How Much Can a Trader Make With a 1% Profit Target?
A trader using a 1% profit target can earn anywhere from $10 to $1,000 or more on a successful trade, depending on their position size.
For example, a $1,000 position generates $10 in gross profit, while a $10,000 position generates $100 when the same 1% target is reached.
This illustrates an important principle:
Traders don't necessarily need to chase larger percentage gains to increase their dollar-based profits. Instead, they can potentially increase their earnings by scaling position sizes while maintaining the same profit targets, stop-losses, and trading strategy.
However, increasing position size also increases potential dollar losses. A 2% stop-loss on a $1,000 position risks $20, whereas the same stop-loss on a $50,000 position risks $1,000.
Ultimately, position sizing should reflect a trader's available capital, risk tolerance, and the historical performance of their strategy.
Build a Smarter Trading Strategy
Looking to improve your trading knowledge? Explore this book as you work toward developing a more disciplined, consistent approach to trading.
View Book on Amazon →Same 1% Profit Target. Different Dollar Returns.
Hypothetical gross profits when a trader successfully captures a 1% gain on different position sizes.
Bar lengths represent relative dollar profits, scaled to the $500 maximum.
Key Takeaway: Increasing a position from $1,000 to $50,000 increases the potential gross profit from $10 to $500 at the same 1% target. However, dollar losses also scale proportionally, making position sizing and risk management equally important.
Illustrative successful trades only. Assumes the full 1% profit target is realized. Excludes commissions, slippage, fees, taxes, and other execution costs. Larger positions may encounter liquidity and execution constraints.
The Real Goal: Build a Repeatable, Scalable Trading Strategy
Ultimately, how much most day traders make per day is far less important than how consistently they can generate profitable returns.
A trader earning 1% on a $10,000 position makes the same $100 as someone earning 10% on a $1,000 position, but those returns may involve vastly different levels of risk.
The real objective is to develop a repeatable trading strategy with positive expectancy, manageable drawdowns, and clearly defined profit targets and stop-losses.
Once a strategy has been properly backtested and refined, traders can explore scaling their position sizes without necessarily chasing larger percentage gains.
Ultimately, the main takeaway is:
Stop asking how many dollars a day traders make. Start asking what percentage returns their strategies generate, how much risk they take to achieve them, and whether those returns are repeatable.
Learn the Fundamentals of Technical Analysis
John J. Murphy's Technical Analysis of the Financial Markets covers charts, trends, indicators, candlesticks, intermarket relationships, and other core technical analysis concepts.
Price: $34.27–$35.50
View on Amazon →If you want to go deeper:
- Explore the Trading Statistics Hub to understand how different sectors behave across market cycles
- Study real setups inside the Trade Reviews section
- Learn the framework behind high-probability setups in the Post-Earnings Momentum Strategy
This is how you turn raw market data into repeatable trading edge.


Leave a Reply