

Dutch Bros (BROS) plunged 19.17% during its first hourly earnings candle, creating a bearish Post-Earnings Momentum (PEM) setup. However, entering short at the hourly close produced a hypothetical +2.82% EOD gain with an −11.05% MAE, while waiting for an EMA pullback could have delivered a gain closer to +10% with just −2% to −3% MAE. This case study compares both entry strategies, highlighting how entry timing affects profitability, risk, and trade participation—and why neither approach is necessarily superior.

Not every profitable trading setup produces the same results. Sometimes, where a trader enters a position matters just as much as the direction of the trade itself.
Dutch Bros Inc. (NYSE: BROS) is a rapidly growing American drive-thru coffee chain operating in the consumer cyclical sector. At the time of this case study, the company had a market capitalization of approximately $8.29 billion, with short interest representing roughly 15.76% of its float.
Following its November 4, 2026, earnings announcement, BROS shares plunged 19.17% during the first hourly earnings candle, creating a bearish Post-Earnings Momentum (PEM) setup.
However, the trade’s eventual profitability depended heavily on the entry method.
In the following BROS case study, we’ll examine not one, but TWO different potential entries to demonstrate how entry timing can dramatically change the risk and reward of an otherwise identical PEM setup.
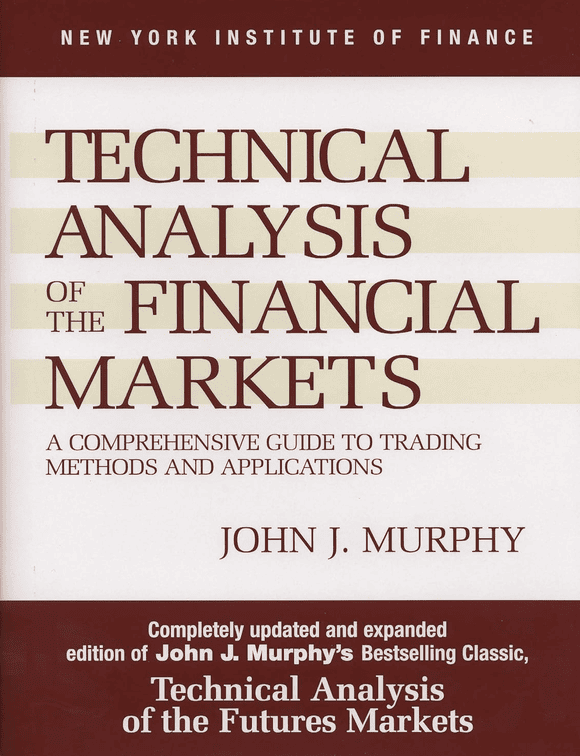
Learn the Fundamentals of Technical Analysis
John J. Murphy’s Technical Analysis of the Financial Markets covers charts, trends, indicators, candlesticks, intermarket relationships, and other core technical analysis concepts.
Price: $34.27–$35.50
View on Amazon →BROS Q3 Earnings Results & Fundamentals
On November 4, 2026, Dutch Bros reported third-quarter earnings that revealed strong year-over-year growth but mixed results relative to analyst expectations.
Here’s a look at the report’s key highlights:
BROS Q3 2026 Earnings Snapshot
Reported November 4, 2026 | Dutch Bros Inc. (NYSE: BROS)
+4.17% beat
Whisper estimate: $0.26
+0.16% beat
Updated guidance: At least $2.1B
Previous upper-end target removed.
Fundamentally, the quarter was far from disastrous. Dutch Bros continued delivering impressive revenue and earnings growth, while reported results remained largely in line with Wall Street expectations.
However, the reduction in the upper end of its annual revenue guidance, combined with an earnings miss relative to the consensus number, may have contributed to the negative market reaction.
Regardless of the precise catalyst, the stock’s immediate price action told a much clearer story.
Investors were selling BROS aggressively, and the first hourly earnings candle established a bearish PEM setup.

Benjamin Graham & Jason Zweig
$13.94 Listed priceBROS Technical Analysis & PEM Setup
So, the overall quarterly report and fundamental picture were NOT bad by any means. However, for momentum traders, the objective is never about determining whether a company is overvalued or undervalued.
It’s simply to identify the direction of the initial post-earnings move and evaluate whether that momentum might continue into the following session based on a handful of setup criteria.
Following the earnings announcement, BROS shares declined 19.17% during the first hourly earnings candle, establishing a powerful bearish momentum signal. The stock also broke below its previous hourly and four-hour trading ranges, producing a breakout score of 2.

Interestingly, the candle itself exhibited relatively small upper and lower wick retracements, suggesting sellers maintained control throughout much of the initial move.
But what happened afterward illustrates an important distinction between identifying a profitable setup and executing a profitable trade.

Option Volatility and Pricing
A comprehensive guide to options pricing, volatility, trading strategies, and risk management. An excellent resource for traders looking to understand market volatility beyond simply predicting stock direction.
Check Price on Amazon →Affiliate disclosure: We may earn a commission from qualifying purchases at no additional cost to you.
Entry Method #1: Short at the Hourly Earnings Candle Close
The first entry method is straightforward and is the method I use most often when trading and documenting PEM setups.
For this entry method, a trader simply identifies the direction of the first hourly earnings candle and enters a position at its closing price.
In the case of BROS, that meant entering short immediately following the 19.17% decline. That would have produced an average entry price around $35.50 per share.

Based on that entry, the trade would produced the following results:
BROS: Hourly Candle Close Entry
Hypothetical short trade | Next-session EOD exit
Although BROS eventually closed the following session below the hypothetical short entry price, the path to profitability was anything but comfortable. The stock initially rebounded sharply, moving 11.05% against the short position before resuming its decline.
Ultimately, the trade was profitable, but it required tolerating considerable unrealized losses before getting there. And even then, this hourly close entry only produced a +2.82% gain.
In hindsight, we can pinpoint how we could have traded this same setup in a way that would have experience a significantly smaller MAE and a much larger EOD gain.
Entry Method #2: Wait for an EMA Pullback
The second approach involves waiting for the stock to retrace toward its exponential moving averages before entering in the direction of the original hourly earnings move.
Rather than immediately shorting BROS after its initial 19.17% decline, a trader could have waited for the subsequent rebound, and then gotten short when price re-tested in its shorter-term moving averages.

As BROS recovered toward its EMA cloud, the stock presented a potential short entry closer to $38–$39 per share.
This entry would have been substantially higher than the original hourly closing price, improving the potential profitability of the short position.
Depending on the exact execution price, a hypothetical EMA pullback trade could have produced:
BROS: EMA Pullback Entry
Hypothetical short trade | 6-9-12 EMA retracement
These are, of course, illustrative estimates rather than verified executable trade results. Actual returns would depend on the precise entry, exit, and intraday price path.
Nevertheless, the difference is significant.
Instead of enduring an 11.05% adverse excursion for a relatively modest +2.82% gain, a trader entering near the EMA cloud could potentially have experienced substantially less adverse movement while capturing a much larger percentage return.
The direction of the trade never changed. Only the entry price changed.
BROS: Two Entries, Different Results
Same bearish PEM setup. Different entry timing.
Hourly Candle Close
6-9-12 EMA Pullback
Which PEM Entry Method Is Better?
The BROS setup highlights two primary approaches to trading post-earnings momentum.
1. Enter at the close of the hourly earnings candle.
This method prioritizes participation. By entering immediately after the first hourly candle closes, traders avoid waiting for a pullback that may never occur.
The disadvantage is that entering after a substantial initial move can expose traders to significant reversals, potentially producing larger MAEs and less favorable entry prices.
2. Wait for an EMA pullback before entering.
This method prioritizes entry price. Waiting for a retracement can provide a more favorable position and potentially improve the trade’s risk-to-reward characteristics.
However, some stocks continue moving in their original direction without ever revisiting their EMAs. In those situations, traders waiting for a pullback may miss otherwise profitable setups entirely.
PEM Entry Method Comparison
| Variable | Hourly Close Entry | EMA Pullback Entry |
|---|---|---|
| Entry Timing | Immediate | Delayed |
| Trade Participation | Potentially higher | Potentially lower |
| Entry Price | Initial hourly close | Potentially more favorable |
| MAE | Potentially higher | Potentially lower |
| MFE From Entry | Potentially lower | Potentially higher |
| Missed Opportunities | Fewer | More |
These are theoretical trade-offs, not established statistical conclusions. But importantly, neither method is inherently right or wrong.
The hourly close method offers a repeatable, rules-based approach to capturing post-earnings momentum, while the EMA pullback method offers an alternative for traders willing to sacrifice some opportunities in exchange for potentially better entries.
And as BROS demonstrates, both approaches could have produced profitable outcomes from the same bearish setup.
Conclusion: Entry Price Matters, but So Does Participation
The Dutch Bros post-earnings selloff provides an excellent example of how two traders identifying the same opportunity can experience dramatically different results.
Shorting at the close of the hourly earnings candle produced a hypothetical +2.82% EOD gain with an −11.05% MAE.
Waiting for an EMA retracement could potentially have produced a gain closer to +10% with only −2% to −3% MAE.
But that doesn’t automatically make the EMA entry superior.
The trader entering immediately captured the setup without needing a retracement. The trader waiting for an EMA pullback depended on the market providing a second opportunity that may have never come.
The real insight here is that you NEVER know how a setup will play out, no matter what! Which is why planned trades, risk management, and backtesting your strategy are crucial when trading highly volatile post-earnings momentum setups.
Ultimately, the best entry isn’t necessarily the one that produces the largest gain on a single trade. It’s the one that produces the most consistent, repeatable results across a large sample of trades.
BROS simply demonstrates that a tradeable PEM setup can produce very different outcomes depending on how—and when—a trader chooses to participate.
If you want to go deeper:
- Explore the Trading Statistics Hub to understand how different sectors behave across market cycles
- Study real setups inside the Trade Reviews section
- Learn the framework behind high-probability setups in the Post-Earnings Momentum Strategy
This is how you turn raw market data into repeatable trading edge.


Leave a Reply