

In this article, you’ll learn how to trade post-earnings momentum using original research from 205 stock setups, including the technical analysis signals, entry strategies, and exit rules associated with stronger trading outcomes. Our study found a 58.0% positive-outcome rate, +2.49% average closing return, and +10.00% average maximum favorable excursion. You’ll also discover why stocks with initial earnings reactions below 5% averaged +8.23%, while those moving 20% or more averaged −2.05%, and how multi-timeframe breakouts, stop-loss placement, and profit-taking can influence trading performance.

One of the biggest questions traders face during earnings season is whether to buy stocks before or after an earnings report.
Buying before an announcement offers the potential to capture an enormous price movement, but it also exposes traders to the possibility of an unexpected earnings gap in the wrong direction.
Waiting until after earnings provides another approach.
Rather than predicting whether a company will beat expectations, traders can evaluate the actual market reaction, analyze technical indicators, and look for opportunities to trade momentum.
However, waiting also means potentially missing the largest part of the initial price movement.
At Paper Trading Journal, we’ve been studying these opportunities through our Post-Earnings Momentum Database.
Our latest analysis includes 244 recorded stock setups, with 205 completed setups meeting our screening criteria. We examined first-hour price reactions, technical breakouts, maximum favorable and adverse excursions, and subsequent closing returns.
The results were surprising. Across these 205 setups, 58.0% produced positive directional closing returns, averaging +2.49% per setup.
However, understanding when to enter, which setups to avoid, and when to exit may matter more than simply identifying stocks making big moves.

Quick Answer: Should I Trade Stocks Before or After an Earnings Report?
Trading after earnings allows traders to evaluate actual price action rather than predict the announcement. In our analysis of 205 post-earnings momentum setups, 58.0% produced positive directional closing returns, averaging +2.49%. Surprisingly, setups with first-hour moves below 5% averaged +8.23%, while those moving 20% or more averaged −2.05%. Although these findings support further research into trading after earnings, our dataset does not directly establish whether buying after earnings is more profitable than buying beforehand.
Learn the Fundamentals of Technical Analysis
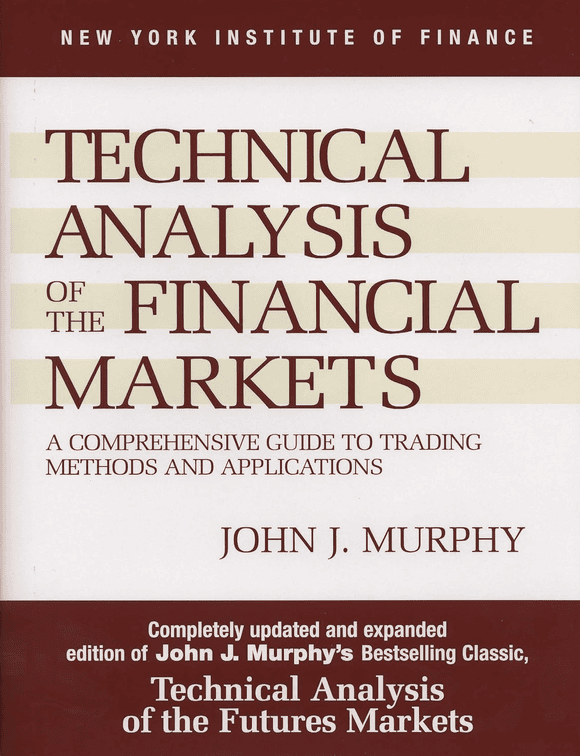
John J. Murphy’s Technical Analysis of the Financial Markets covers charts, trends, indicators, candlesticks, intermarket relationships, and other core technical analysis concepts.
Price: $34.27–$35.50
View on Amazon →Key Statistics: Trading Stocks After Earnings
Source: Paper Trading Journal, Post-Earnings Momentum Tracker 2026. Statistics reflect 205 screened setups, with results measured before trading costs. Positive returns include both bullish and bearish directional setups.
Post-Earnings Momentum Produced a 58% Positive Outcome Rate
Our first major finding was that 119 of 205 post-earnings setups (58.0%) produced positive directional closing returns, with an average gain of +2.49% and a median return of +1.98%.
These results suggest that earnings momentum frequently continues beyond the initial price reaction, creating opportunities for traders who wait until after the announcement.
Our strategy uses the closing price of the first hourly earnings candle as its reference entry.
Importantly, our research includes both bullish and bearish setups. A stock falling after earnings can generate a positive directional return for a trader shorting the stock.
The biggest advantage? We’re trading the market’s actual reaction instead of guessing how earnings will unfold. However, these historical results are hypothetical and exclude commissions, spreads, slippage, and other trading costs.
Learn the Fundamentals of Technical Analysis
John J. Murphy’s Technical Analysis of the Financial Markets covers charts, trends, indicators, candlesticks, intermarket relationships, and other core technical analysis concepts.
Price: $34.27–$35.50
View on Amazon →Smaller Earnings Reactions Produced Surprisingly Better Returns
Perhaps the most surprising finding from our research was that stocks experiencing smaller initial earnings reactions actually produced better subsequent average returns than stocks experiencing enormous first-hour movements.
We divided the 205 setups into four groups based on the absolute percentage change of their initial hourly earnings candle.
First-Hour Earnings Reactions vs. Trading Performance
| First-Hour Reaction |
Setups | Positive Outcomes |
Avg. Closing Return |
|---|---|---|---|
| Below 5% | 19 | 89.5% | +8.23% |
| 5% to below 10% | 74 | 62.2% | +3.22% |
| 10% to below 20% | 86 | 53.5% | +1.97% |
| 20% or more | 26 | 38.5% | −2.05% |
Source: Paper Trading Journal, 205 post-earnings momentum setups. First-hour reactions are measured by absolute percentage change.
The difference was substantial. Stocks moving less than 5% during their first earnings-related hourly candle subsequently produced an average directional closing return of +8.23%, with 89.5% finishing positively.
Meanwhile, the 26 setups that experienced initial reactions of at least 20% averaged a −2.05% closing return, with just 38.5% finishing positively.
That’s a 10.28-percentage-point difference in average closing performance between the smallest and largest reaction groups.
Why might this happen?
One possible explanation is that enormous initial earnings reactions leave stocks technically overextended. After a company experiences a 20%, 30%, or even 50% price movement, some traders may begin taking profits, while others avoid entering at extended prices.
Bigger Earnings Moves ≠ Better Returns
Average directional closing returns by first-hour earnings reaction
Key Finding: The largest initial earnings reactions produced weaker average follow-through, despite substantial volatility.
Source: Paper Trading Journal, 205 screened post-earnings setups. Groups contain 19 and 26 observations, respectively. Historical associations do not establish causation.
Smaller reactions, meanwhile, may leave additional room for continued price discovery as institutional traders and other market participants reassess earnings results, forward guidance, and valuation.
However, these explanations are hypotheses rather than conclusions established by our data. The below-5% group also contains just 19 setups, making it particularly sensitive to a few exceptional winners.
Our research challenges the assumption that the biggest earnings movers necessarily make the best momentum trades. Rather than automatically pursuing stocks experiencing enormous initial reactions, traders may benefit from examining smaller moves that still demonstrate favorable technical structures.

Amazon Affiliate Link
Want to Read Trading in the Zone?
If you want to read Mark Douglas’s Trading in the Zone for yourself, you can check the current listing on Amazon. Copies are currently listed for as low as $23.00.
Check Price on Amazon →This link takes you to Amazon. As an Amazon Associate, I may earn a commission from qualifying purchases at no additional cost to you. Prices can change at any time.
Technical Analysis and Multi-Timeframe Breakouts Improved Average Results
Technical analysis played another important role in our research, particularly when evaluating stocks experiencing breakouts across multiple chart timeframes.
Our tracker records breakout confirmation using hourly, four-hour, and daily price charts. Each setup receives a recorded score indicating how many of these confirmations were present.
We compared setups with stronger technical confirmation against those with fewer confirmed breakouts.
Multi-Timeframe Breakout Scores vs. Trading Performance
| Breakout Score |
Setups | Avg. Closing Return |
Avg. Adverse Excursion |
|---|---|---|---|
| 0 | 85 | +1.84% | −6.57% |
| 1 | 37 | +2.26% | −6.31% |
| 2 | 40 | +3.84% | −4.51% |
| 3 | 42 | +2.49% | −5.35% |
Key Finding: Setups with exactly 2 breakout confirmations produced the highest average closing return of +3.84%, alongside the lowest average adverse excursion of −4.51%.
Source: Paper Trading Journal, Post-Earnings Momentum Tracker 2026. Results cover 204 setups with recorded breakout scores. One screened setup lacked a score.
Combining setups with two or three breakout confirmations produced 82 observations averaging +3.15% closing returns, compared with +1.97% among the 122 setups with zero or one confirmation.
The stronger-confirmation group also experienced less average adverse movement, at −4.94% compared with −6.49%.
These results suggest that multi-timeframe technical analysis may provide useful information when evaluating post-earnings momentum.
However, more breakout confirmations did not automatically produce better results. Setups with two confirmations averaged +3.84%, outperforming those with three confirmations, which averaged +2.49%.
The lesson is that technical confirmation may help improve average setup quality, but no single chart pattern guarantees profitable follow-through.
Learn the Fundamentals of Technical Analysis
John J. Murphy’s Technical Analysis of the Financial Markets covers charts, trends, indicators, candlesticks, intermarket relationships, and other core technical analysis concepts.
Price: $34.27–$35.50
View on Amazon →Stocks Often Reached Their Best Prices Before the Closing Exit
Another significant discovery involved the difference between a stock’s maximum favorable movement and its eventual closing return.
Across our 205 setups, average maximum favorable excursion was approximately +10.00%, while the average directional closing return was just +2.49%.
That represents a difference of approximately 7.51 percentage points between the best favorable movement recorded and the eventual closing outcome.
Maximum favorable excursion, or MFE, measures how far a stock moves in the hypothetical trade’s favor after the reference entry.
For example, a trader might enter a stock at $100, watch it climb to $112, and eventually exit at $103. Although the stock provided a theoretical 12% favorable price movement, the realized return from that exit would be only 3%, before expenses.
How Often Did Stocks Reach Major Profit Levels?
Key Finding: 40% of setups reached at least +10% favorable excursion, highlighting the importance of effective profit-taking and exit strategies.
Source: Paper Trading Journal, 205 post-earnings momentum setups. MFE represents maximum favorable price movement after the reference entry, not realized trading profits.
Without an effective exit strategy, traders may experience considerable unrealized profits only to surrender them as prices reverse or momentum fades.
This is particularly relevant when comparing active profit targets against passive end-of-day exits.
Importantly, the difference between average MFE and average closing return does not represent profits that traders could automatically have captured. The exact intraday high or low is only identifiable in hindsight.
A successful trading strategy must account for both identifying favorable price movements and establishing realistic, repeatable exit rules.
Post-Earnings Volatility Makes Stop-Loss Placement Difficult
Although our research identified substantial favorable price movements, it also revealed how much adverse volatility traders may encounter.
Across the 205 completed setups, average maximum adverse excursion was −5.86%, while the median was −4.32%.
Maximum adverse excursion, or MAE, represents the largest unfavorable price movement recorded after the reference entry.
How Often Did Stocks Experience Significant Adverse Movement?
Key Finding: 44.4% of setups experienced at least 5% adverse movement, highlighting the importance of stop-loss placement, position sizing, and managing post-earnings volatility.
Source: Paper Trading Journal, 205 screened post-earnings momentum setups. MAE represents the maximum unfavorable price movement after the reference entry. Thresholds are cumulative.
These findings raise important questions about conventional stop-loss placement when trading highly volatile stocks following earnings announcements.
For example, a trader using a fixed 5% stop-loss may be removed from a position during temporary price fluctuations, even if the stock eventually moves favorably.
Our tracker also records whether setups reached a +9% profit target before triggering a −5% stop-loss.
Although 93 setups (45.4%) reached at least +9% favorable excursion at some point, just 78 setups (38.0%) were explicitly recorded as reaching the +9% target before the −5% stop.
This distinction is important because simply measuring whether a stock eventually reaches a profit target does not account for whether a stop-loss would have closed the position first.
However, these statistics do not prove that wider stop-loss orders are necessarily better. Wider stops increase potential losses and require corresponding adjustments to position sizing.
The most effective stop-loss and profit-target combinations must account for both expected volatility and the order in which price levels are reached.
Learn the Fundamentals of Technical Analysis
John J. Murphy’s Technical Analysis of the Financial Markets covers charts, trends, indicators, candlesticks, intermarket relationships, and other core technical analysis concepts.
Price: $34.27–$35.50
View on Amazon →Real Post-Earnings Examples: PENG, RGP, and ACN
Several recent stocks from our case studies database illustrate how different earnings reactions can produce substantially different trading opportunities.
Three particularly interesting examples include Penguin Solutions (PENG), Resources Connection (RGP), and Accenture (ACN).
Real Post-Earnings Momentum: PENG vs. RGP vs. ACN
| Stock | First-Hour Move |
MFE | MAE | Closing Return |
|---|---|---|---|---|
| PENG | +3.35% | +14.81% | −2.01% | +9.34% |
| RGP | −9.92% | +14.80% | 0.00% | +11.36% |
| ACN | +9.69% | +12.40% | −0.48% | +4.97% |
Key Finding: All three setups achieved more than +12% maximum favorable excursion, despite different initial earnings reactions. RGP demonstrates that bearish momentum can also produce positive directional returns.
Source: Paper Trading Journal, Post-Earnings Momentum Tracker 2026. MFE, MAE, and closing returns are directional measurements. RGP represents a bearish setup.
Penguin Solutions (PENG): Small Initial Reaction, Strong Follow-Through

PENG provided an example of how a relatively modest earnings reaction can develop into a substantial momentum trade. Its initial hourly earnings candle recorded a +3.35% move, placing the stock within our smallest reaction category.
However, following our reference entry, the stock recorded +14.81% maximum favorable excursion, just −2.01% maximum adverse excursion, and a +9.34% directional closing return.
The setup illustrates why traders should not automatically dismiss stocks experiencing smaller initial reactions, particularly when supported by constructive technical analysis.
Resources Connection (RGP): Profiting From Bearish Momentum

RGP demonstrates that post-earnings momentum opportunities are not limited to stocks moving higher. After an initial −9.92% hourly earnings reaction, the bearish setup recorded +14.80% favorable excursion and a +11.36% positive directional closing result.
Its recorded maximum adverse excursion was 0.00%.
These positive performance figures describe the hypothetical short setup rather than an appreciation in RGP’s share price.
Accenture (ACN): Strong Momentum With a Significant Pullback From Peak Gains

ACN experienced a +9.69% initial hourly earnings reaction, followed by +12.40% maximum favorable excursion and just −0.48% adverse excursion.
However, the stock’s eventual directional closing return was +4.97%, considerably lower than the maximum favorable movement available during the tracking window.
This provides another example of how even relatively strong momentum setups can surrender significant unrealized profits before a passive closing exit.
Together, these examples demonstrate why earnings reactions, technical analysis, and exit execution should be evaluated as separate components of a trading strategy.
Historical Setup Explorer
Search a stock ticker to browse every chart and image from its PTJ case study without leaving this page.
What Our Research Cannot Tell Us About Buying Before Earnings
While our findings highlight several post-earnings momentum patterns, our study does not directly compare buying stocks before versus after earnings announcements.
All 205 setups use the closing price of the first hourly earnings candle as the reference entry. Therefore, our results cannot determine whether holding through earnings is more profitable or how frequently stocks rise or fall before announcements.
Our dataset also includes manually selected setups, repeated companies, and subjective technical classifications. Returns exclude trading costs and do not represent verified live trading performance.
Ultimately, our research identifies measurable patterns in post-earnings momentum, not a guaranteed trading advantage. Determining whether buying before or after earnings produces better results would require a separate comparative backtest.
Conclusion: Is It Better to Buy Stocks Before or After Earnings?
Trading a stock before earnings requires traders to accept the uncertainty of an upcoming announcement and the possibility of a substantial overnight price gap.
Trading afterward allows traders to observe the market’s initial reaction, evaluate technical analysis signals, and establish entries based on actual price movement.
Ultimately, successful momentum trading depends on more than identifying stocks experiencing large earnings reactions. Entry selection, risk management, technical confirmation, and exit execution all matter.
Learn the Fundamentals of Technical Analysis
John J. Murphy’s Technical Analysis of the Financial Markets covers charts, trends, indicators, candlesticks, intermarket relationships, and other core technical analysis concepts.
Price: $34.27–$35.50
View on Amazon →If you want to go deeper:
- Explore the Trading Statistics Hub to understand how different sectors behave across market cycles
- Study real setups inside the Trade Reviews section
- Learn the framework behind high-probability setups in the Post-Earnings Momentum Strategy
This is how you turn raw market data into repeatable trading edge.
More Trading Statistics…


Frequently Asked Questions
Should I Buy Stock Before or After an Earnings Report?
Buying before earnings offers the opportunity to capture the initial price reaction but carries substantial overnight gap risk. Waiting until after earnings allows traders to evaluate actual price action before entering a position. In our analysis, 119 of 205 post-earnings setups (58.0%) produced positive directional closing returns, averaging +2.49%. However, these results do not prove that buying after earnings is more profitable than buying beforehand. The better approach depends on your trading strategy, risk tolerance, and investment timeframe.
Do Stocks Drop Before the Earnings Report?
Stocks sometimes decline before earnings as investors take profits, reduce exposure, or anticipate disappointing results. However, other stocks rise ahead of announcements as expectations for strong earnings or forward guidance increase. There is no universal pattern requiring stocks to fall before earnings. Our research focuses on post-earnings price movements, so the 205 analyzed setups cannot establish how frequently stocks decline before their earnings announcements.
Is It Better to Buy Options Before or After Earnings?
Buying options before earnings offers exposure to potentially substantial price movements but also introduces implied volatility crush, which occurs when options premiums decline as anticipated volatility falls after an announcement. Consequently, traders can correctly predict a stock’s direction and still lose money on their options positions. Buying options afterward may reduce some uncertainty, but it does not eliminate risk. Our research measures underlying stock performance, not options returns, so it cannot establish which approach is more profitable.
Which Stocks Are a Good Buy Before Earnings Reports?
Stocks with strong fundamentals, favorable earnings expectations, increasing trading volume, and constructive technical analysis setups may be worth researching before earnings. Our post-earnings study found that 82 setups with two or three multi-timeframe breakout confirmations averaged +3.15% closing returns, compared with +1.97% for 122 setups with zero or one confirmation. Although these findings do not establish which stocks will perform best before an announcement, they suggest that hourly, four-hour, and daily technical structures may help identify promising post-earnings momentum opportunities.
What Is the 3 Day Rule After Earnings?
The three-day rule after earnings is an informal investing guideline suggesting that traders wait approximately three trading days following an earnings announcement before entering a position. The goal is to allow initial volatility, profit-taking, and price discovery to settle. However, waiting three days can also mean missing short-term momentum opportunities. In our research, 58.0% of 205 post-earnings setups produced positive directional closing returns using an entry at the first hourly candle’s close. Our study does not establish whether waiting three days would improve performance, and the rule should not be confused with the longer-term phenomenon known as post-earnings announcement drift.


Leave a Reply