

Accenture (ACN) delivered a strong post-earnings technical analysis setup after reporting better-than-expected results, with EPS of $3.29 versus a $3.19 consensus estimate and revenue of $18.68 billion versus $18.01 billion expected. The first hourly earnings candle surged +9.69%, the stock reached a maximum favorable excursion of +12.40% while experiencing just -0.48% maximum adverse excursion, and ACN ultimately finished the session +4.97% from the setup entry.

Accenture (ACN) is one of the world’s largest consulting and professional services companies, providing technology, digital transformation, cloud, cybersecurity, and artificial intelligence services to businesses and governments around the world.
On October 1, 2026, ACN stock exploded higher after the company reported stronger-than-expected fiscal fourth-quarter earnings and issued an encouraging outlook for fiscal 2027.
At its intraday high, Accenture shares had rallied as much as approximately 24.6% from the previous close, creating one of the strongest post-earnings momentum moves we’ve tracked recently.
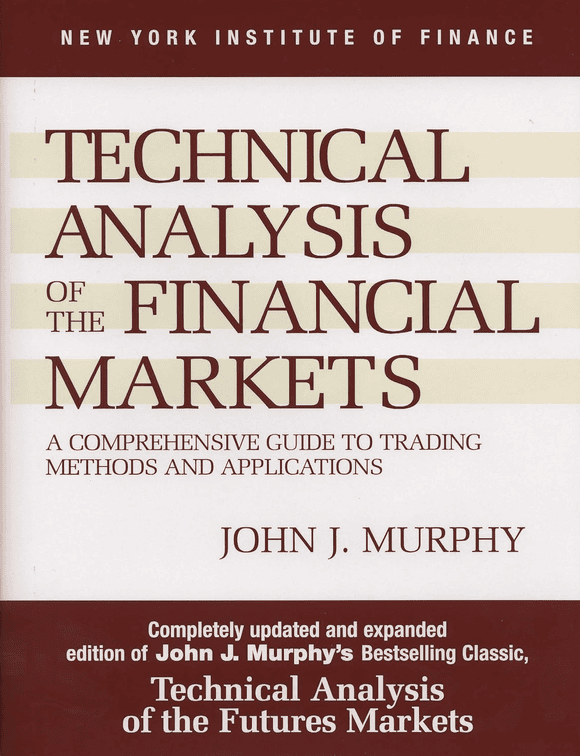
Learn the Fundamentals of Technical Analysis
John J. Murphy’s Technical Analysis of the Financial Markets covers charts, trends, indicators, candlesticks, intermarket relationships, and other core technical analysis concepts.
Price: $34.27–$35.50
View on Amazon →What Is Happening With ACN Stock?
Accenture stock surged after the company reported fiscal Q4 earnings before the market opened on October 1, beating Wall Street expectations for both earnings and revenue while providing fiscal 2027 guidance that called for continued growth. ACN ultimately closed the session 15.78% higher at $212.30. The results also arrived shortly after Accenture expanded its relationship with Anthropic, with both companies committing at least $1 billion each over five years toward AI safety initiatives, reinforcing investor optimism around Accenture’s position in enterprise AI.

ACN Earnings Results & Fundamentals
Accenture reported a strong fiscal fourth quarter, with both earnings and revenue coming in ahead of Wall Street expectations.
The company reported earnings per share of $3.29, compared with consensus expectations of approximately $3.19, representing an earnings beat of roughly 3.1%.
Revenue reached $18.68 billion, approximately 3.7% above consensus estimates of roughly $18.02 billion.
Revenue increased 6% year over year in U.S. dollar terms and 7% in local currency, exceeding the upper end of Accenture’s previous guidance range of $17.75 billion to $18.40 billion.
Importantly, growth was broad-based rather than concentrated in a single geographic region or business segment.
Consulting revenue increased to $9.28 billion, while Managed Services generated approximately $9.40 billion. Both businesses grew roughly 7% in local currency.
Accenture also reported $22.17 billion in new bookings, up 5% in local currency and producing a book-to-bill ratio of 1.2. Accenture Newsroom
Profitability was another positive part of the report. GAAP operating margin increased to 15.3%, while quarterly operating income climbed to approximately $2.86 billion.
Net income reached roughly $2.03 billion, compared with $1.45 billion during the same quarter one year earlier. Accenture Newsroom
The company’s fiscal 2027 guidance also gave investors reasons to remain optimistic.
ACN Guidance
The combination of an earnings beat, revenue beat, strong bookings, expanding profitability, and continued growth guidance appears to have helped alleviate some of Wall Street’s concerns that artificial intelligence could disrupt traditional consulting businesses.
That narrative was strengthened by Accenture’s growing relationship with Anthropic.
On September 18, the companies announced that each expects to invest at least $1 billion during the next five years toward AI safety, model evaluation, red-teaming, alignment assessments, and safeguard testing.

ACN Technical Analysis
From a technical analysis perspective, ACN produced an unusually strong post-earnings momentum setup.
The first hourly earnings candle gained approximately 9.69%, immediately establishing strong upward momentum following the company’s report.

Perhaps even more notable was the structure of the candle itself. The candle closed with essentially no upper or lower wick, meaning buyers controlled the price action through almost the entire hourly period.
Rather than seeing an initial earnings spike followed by immediate profit-taking, ACN moved decisively higher and the hourly earnings candle finished near its high.
That type of candle structure can be particularly significant in momentum trading because it suggests that the market had reached relatively strong agreement about the direction of the initial reaction.

The move also produced a multi-timeframe breakout.
ACN broke through technical resistance on both the hourly and four-hour charts.
The daily chart had not yet produced the same confirmed breakout at the time of the initial move, but the shorter timeframes clearly showed a significant alignment and change in momentum.

Learn the Fundamentals of Technical Analysis
John J. Murphy’s Technical Analysis of the Financial Markets covers charts, trends, indicators, candlesticks, intermarket relationships, and other core technical analysis concepts.
Price: $34.27–$35.50
View on Amazon →ACN Maximum Favorable Excursion
Using the close of the first hourly earnings candle as the theoretical entry point, ACN continued moving substantially higher.
The trade eventually reached a Maximum Favorable Excursion of +12.40%.
In other words, even after ACN had already climbed nearly 10% during its first earnings candle, the stock still provided another 12.4% of potential upside from the candle’s closing price.

That left plenty of price action for traders to get long and ride the momentum throughoutthe trading session.
ACN eventually topped out near $227 per share and formed a reversal candlestick pattern. But that doesn’t mean the setup didn’t provide enough price action for a profitable trade.
A stock moving sharply after earnings does not necessarily mean that the opportunity has already disappeared.
In this example, the initial +9.69% candle was followed by another double-digit favorable excursion.
ACN Maximum Adverse Excursion
The setup also showed remarkably limited downside relative to its upside potential.
From the closing price of the hourly earnings candle, ACN’s Maximum Adverse Excursion was only approximately -0.48% during the trading session. That produced an unusually asymmetric intraday risk-to-reward profile:
MFE: +12.40%
MAE: -0.48%
The stock therefore moved much farther in the favorable direction than it ever moved against the theoretical entry at the close of the hourly earnings candle.

ACN End-of-Day Result
ACN eventually pulled back from its intraday highs, but the trade remained strongly profitable based on the PTJ methodology.
From the close of the first hourly earnings candle to the end of the regular trading session, ACN finished approximately +4.97% higher. And the stock itself closed the full session at $212.30, up 15.78% from the previous day’s close.
This produced a particularly interesting momentum profile:
Under a hypothetical +9% profit target and -5% stop-loss strategy, the profit target would have been reached before the stop-loss.
Key Takeaway
Accenture’s October 1 earnings reaction provides a strong example of what can happen when positive fundamentals and decisive technical momentum occur at the same time.
Accenture beat earnings and revenue expectations, posted strong bookings and healthy margins, and paired continued fiscal 2027 growth guidance with expanding enterprise AI opportunities through its Anthropic partnership.
Technically, the post-earnings momentum setup was equally compelling.
ACN gained 9.69% during its first hourly earnings candle, produced almost no wick on either side of the candle, broke through resistance on multiple timeframes, and ultimately reached a +12.40% MFE while experiencing only a -0.48% MAE.
Ultimately, ACN represents a particularly clean example of a strong post-earnings setup, which included immediate momentum, technical confirmation, and substantial continuation after the initial earnings candle.
Learn the Fundamentals of Technical Analysis
John J. Murphy’s Technical Analysis of the Financial Markets covers charts, trends, indicators, candlesticks, intermarket relationships, and other core technical analysis concepts.
Price: $34.27–$35.50
View on Amazon →If you want to go deeper:
- Explore the Trading Statistics Hub to understand how different sectors behave across market cycles
- Study real setups inside the Trade Reviews section
- Learn the framework behind high-probability setups in the Post-Earnings Momentum Strategy
This is how you turn raw market data into repeatable trading edge.


Leave a Reply