

In this study, we compare 66 AMC earnings reports with 36 BMO reports to see which produced stronger post-earnings momentum and better trading outcomes. We look at first-hour moves, maximum favorable excursion, end-of-day returns, and how technical analysis factors such as hourly and 4-hour breakouts changed the results. AMC stocks moved more initially, averaging 13.10% versus 9.34% for BMO, but BMO setups finished positive more often at 58.3% versus 43.9%.

Earnings reports are usually released either before the market opens or after the market closes. Traders often refer to these two reporting windows as BMO, or before market open, and AMC, or after market close.
But does the timing of an earnings report actually matter for traders?
An after-market-close earnings report gives investors an entire evening and pre-market session to digest the results before regular trading begins. Before-market-open earnings, on the other hand, leaves just a few hours, or sometimes minutes, before the opening bell.
We analyzed more than 100+ post-earnings momentum setups from our 2026 tracker, including 66 AMC reports and 36 BMO reports, to see whether one reporting window produced better trading opportunities.
Here’s what we found…
Quick Answer: Is It Better to Trade a Stock Before or After Earnings?
For most traders, buying a stock after its earnings report reduces the uncertainty of holding through the announcement itself, although it also means missing the initial earnings gap. In our study of 102 post-earnings setups, stocks reporting before market open produced better subsequent trading results than stocks reporting after market close. BMO stocks averaged a +1.92% end-of-day return from our first-hour entry point compared with just +0.09% for AMC stocks, while 58.3% of BMO trades finished positive versus 43.9% of AMC trades. These results do not prove that BMO earnings are inherently better, but they suggest that earnings timing may be a useful factor when evaluating post-earnings momentum.
Learn the Fundamentals of Technical Analysis
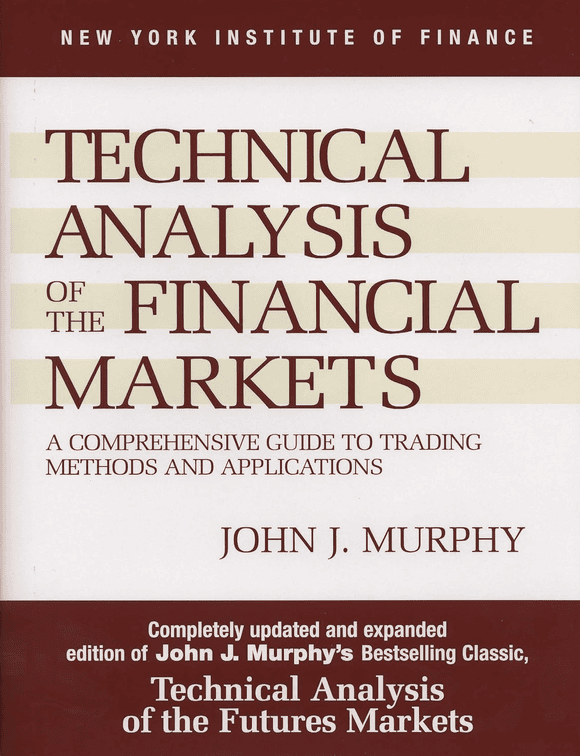
John J. Murphy’s Technical Analysis of the Financial Markets covers charts, trends, indicators, candlesticks, intermarket relationships, and other core technical analysis concepts.
Price: $34.27–$35.50
View on Amazon →Key Statistics: BMO vs. AMC Earnings
AMC Earnings Produced Bigger Moves, But BMO Stocks Held Their Momentum Better
One of the clearest differences between AMC and BMO earnings reports was the size of the initial reaction.
Stocks reporting after market close moved an average of 13.10% during the first hour, compared with 9.34% for stocks reporting before market open. The median results showed the same pattern, with AMC stocks moving 11.47% compared with 6.93% for BMO stocks.
AMC stocks also produced more favorable movement after our hypothetical entry. Their average maximum favorable excursion, or MFE, was 9.65%, compared with 7.45% for BMO stocks.
At first glance, those results could make AMC earnings appear to be the better opportunity. The stocks moved more after earnings and subsequently offered more upside or downside in the direction of the initial reaction.
The problem, however, was keeping those gains.
Only 43.9% of AMC setups finished the following trading session with a positive return from our entry, compared with 58.3% of BMO setups.
The average AMC trade finished the session up just 0.09%. BMO trades averaged +1.92%.
The medians produced an even more noticeable difference. The median AMC setup ended the day down 0.49%, while the median BMO setup was still up 3.05%.
They finished positive more often and produced substantially stronger average and median end-of-day returns.
This suggests an important distinction between volatility and usable momentum.
AMC reports created the bigger initial moves in our sample, but those moves were considerably more likely to fade. BMO earnings produced smaller reactions but did a better job of maintaining their direction after the first hour.
Why Might AMC Earnings Fade More?
One possible explanation is that AMC earnings give the market more time to digest the news before the next regular trading session begins.
For an AMC report, traders and investors can react throughout after-hours trading, overnight and again in pre-market, which may mean more of the initial price discovery has already happened before our first-hour entry. BMO reports compress that process into a much shorter window before the opening bell.
That may help explain why AMC stocks produced the larger average first-hour move in our sample, 13.10% versus 9.34% for BMO, yet were less likely to hold those gains.
Only 43.9% of AMC setups finished positive by EOD, compared with 58.3% of BMO setups, while average EOD returns were +0.09% for AMC versus +1.92% for BMO. Our data does not prove that timing caused the difference, but it gives us a strong hypothesis to keep testing.
Released
Trading
Pre-Market
Session
Released
Begins Soon After
Learn the Fundamentals of Technical Analysis
John J. Murphy’s Technical Analysis of the Financial Markets covers charts, trends, indicators, candlesticks, intermarket relationships, and other core technical analysis concepts.
Price: $34.27–$35.50
View on Amazon →BMO Earnings Performed Better Using Our +9% Profit Target and -5% Stop
The difference became even more noticeable when we tested the setups using one of the standardized exit systems used throughout our post-earnings research.
For this test, each trade used a +9% profit target, a -5% stop loss, or an end-of-day exit when neither level was reached
Among the 66 AMC setups, 19 reached the +9% target before hitting the -5% stop, producing a 28.8% target hit rate. Among the 36 BMO setups, 13 reached the target first, producing a 36.1% hit rate.
AMC setups generated an average return of approximately +0.20% per trade under this system. BMO setups, conversely, averaged approximately +1.89% per trade.
Using identical $1,000 hypothetical positions, that would equal an average result of approximately +$2.03 per AMC trade compared with +$18.88 per BMO trade.
That’s more than nine times the average simulated return per trade. That difference is substantial, but needs to be interpreted cautiously.
Our BMO sample contained only 36 observations, and statistical testing did not find the BMO versus AMC difference significant at the conventional 5% threshold. That means this study should be viewed as evidence worth investigating rather than proof that BMO earnings reports are inherently easier to trade.
The more useful takeaway may be that earnings release timing deserves consideration alongside other variables such as first-hour movement, volume, forward guidance and technical structure.
BMO Earnings With Multi-Timeframe Breakouts Produced the Strongest Results
The most interesting finding appeared when we combined earnings timing with technical confirmation.
We isolated stocks that received a breakout score of two or three in our tracker. These stocks demonstrated breakout confirmation across at least the hourly and 4-hour timeframes.
The resulting sample was small, with only 25 qualifying stocks, but the difference was substantial. There were 14 AMC multi-timeframe breakout setups and 11 BMO setups.
AMC setups produced an average maximum favorable excursion of 6.51%. Whereas, BMO setups produced an average MFE of 10.81%.
Only 35.7% of the AMC setups reached our +9% target before the -5% stop. Among the BMO setups, 63.6% reached the +9% target first.
The end-of-day difference was even larger… AMC multi-timeframe breakout setups averaged an EOD return of -0.61%. Whereas, BMO multi-timeframe breakout setups averaged +6.55%.
Under the +9% target, -5% stop and EOD exit system, AMC setups averaged +1.29% per trade, while BMO setups averaged +4.45% per trade.
This doesn’t mean traders should automatically buy every stock that reports earnings before the opening bell and breaks out on multiple timeframes.
However, the finding supports an idea that has repeatedly appeared throughout our post-earnings research:
The strongest setups may come from combinations of factors rather than any single indicator.
An earnings catalyst alone may not be enough. A breakout alone may not be enough. The reporting time alone may not be enough.
But when a fresh BMO earnings catalyst is followed by a strong initial reaction and confirmation across multiple chart timeframes, the resulting setup may deserve additional attention.
Learn the Fundamentals of Technical Analysis
John J. Murphy’s Technical Analysis of the Financial Markets covers charts, trends, indicators, candlesticks, intermarket relationships, and other core technical analysis concepts.
Price: $34.27–$35.50
View on Amazon →Conclusion: Are BMO or AMC Earnings Better for Traders?
Our data suggests that BMO earnings may offer cleaner post-earnings momentum than AMC reports, but timing alone is not the edge.
The stronger lesson is that the best setups appear when several factors line up: a meaningful earnings reaction, supportive fundamentals, strong technical structure and confirmation across the hourly and 4-hour charts.
That matters because the biggest earnings move is not always the best trade. A stock can explode after earnings and still fade, while a smaller move can become a much stronger setup if momentum holds and multiple forms of confirmation agree.

For now, BMO looks like a useful filter, not a standalone strategy.
As the dataset grows, the real goal is to identify the combination of factors that consistently separates temporary earnings volatility from durable post-earnings momentum.
If you want to go deeper:
- Explore the Trading Statistics Hub to understand how different sectors behave across market cycles
- Study real setups inside the Trade Reviews section
- Learn the framework behind high-probability setups in the Post-Earnings Momentum Strategy
This is how you turn raw market data into repeatable trading edge.


Frequently Asked Questions
Is it better to buy a stock before or after an earnings report?
Buying before earnings gives traders exposure to the initial price reaction but also exposes them to significant event risk because the earnings results, guidance and market reaction are unknown. Waiting until after earnings allows traders to evaluate the actual report and initial price action before entering. Our post-earnings strategy specifically focuses on entering after the announcement and after observing the stock’s initial reaction rather than attempting to predict the earnings result beforehand.
Is it better to buy stocks when the market opens or closes?
Neither the open nor the close is automatically better for buying stocks. For our post-earnings momentum research, we wait until the first hourly candle has closed before establishing a hypothetical entry because this provides time to observe the initial reaction, trading volume and technical structure. Buying immediately at the open can provide an earlier entry but also exposes traders to some of the session’s highest volatility.
Do stocks go up or down after an earnings report?
Stocks can move sharply higher or lower after earnings depending on how the company’s results and outlook compare with market expectations. Revenue and earnings surprises can influence the reaction, but forward guidance, margins, management commentary and previously priced-in expectations can be equally important. A company can beat analyst estimates and still fall if investors expected stronger results, while another company can miss estimates and rise if its outlook improves.
Why are earnings announced after market close?
Many companies release earnings after the market closes so investors have time to review the financial results and management commentary without the announcement immediately affecting regular-session trading. Companies can also hold earnings conference calls and provide additional information before the next regular trading session begins. In our dataset, these AMC announcements produced larger initial moves than BMO reports, although they were also more likely to surrender those gains during the subsequent trading session.
References
Mackintosh, P. (2024, February 15). Like night and day. Nasdaq. https://www.nasdaq.com/articles/night-and-day
Mackintosh, P. (2024). Earnings announcements sliced and diced. Nasdaq. https://www.nasdaq.com/articles/earnings-announcements-sliced-and-diced
Paper Trading Journal. (2026). Post-earnings momentum database. https://papertradingjournal.com/post-earnings-momentum-database/
U.S. Securities and Exchange Commission. (n.d.). After-hours trading: Understanding the risks. https://www.sec.gov/files/investor/pubs/afterhours.htm


Leave a Reply