

In this review of The Little Book of Stock Market Cycles: How to Take Advantage of Time-Proven Market Patterns by Jeffrey A. Hirsch, I’ll break down the book’s biggest ideas, including market seasonality, recurring cycles, the Santa Claus Rally, the January Effect, and presidential election patterns. I’ll also explain the biggest lesson I took from the book: how historical market data can be turned into probabilities and used to build a more statistical approach to trading and investing.

The Little Book of Stock Market Cycles: How to Take Advantage of Time-Proven Market Patterns by Jeffrey A. Hirsch isn’t really a day trading book, but I would still recommend it to anybody learning how to trade or invest.
It doesn’t teach you how to find entries, read candlesticks, manage stop losses, or build an intraday trading strategy.
What it does teach you is something that I think is just as important:
How to look at the stock market statistically instead of treating every move as completely random.
Hirsch explores recurring market cycles, seasonality, election-year tendencies, and other historical patterns that have appeared often enough to be studied.
The book has a 4.1 out of 5 rating on Amazon from more than 170 reviews and around 3.3 out of 5 on Goodreads from roughly 190 ratings. Those ratings are useful context, but for me, the real value of the book was how much it changed the way I thought about market research.
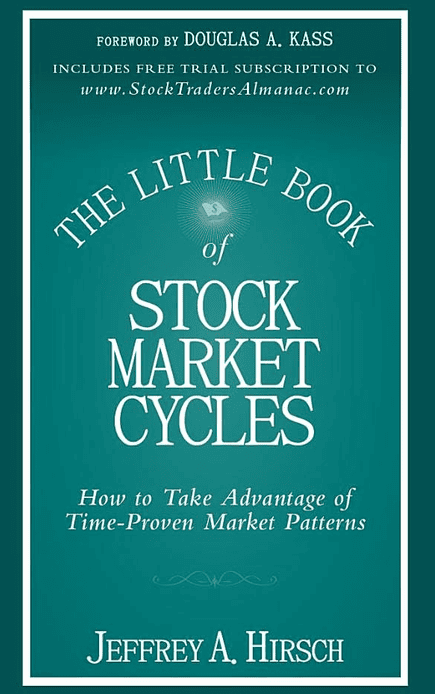
A practical introduction to market seasonality, recurring cycles, and probability-based investing.
View the Book on AmazonWhat Is The Little Book of Stock Market Cycles About?
The central idea behind The Little Book of Stock Market Cycles is fairly simple.
The stock market may be difficult to predict on any individual day, but certain tendencies have occurred frequently enough throughout history that they can be measured, compared, and studied.
Hirsch looks at everything from longer economic cycles to much shorter calendar-based tendencies.
That includes seasonal strength and weakness, presidential election cycles, the Santa Claus Rally, the January Effect, and other patterns that have become familiar to traders and investors over the years.
The important thing is that Hirsch doesn’t present these patterns as guarantees. A seasonal tendency is not the same thing as a trading signal, and the fact that something happened frequently in the past does not mean it has to happen again.
That distinction matters because the real lesson of the book isn’t that the market follows a perfectly predictable calendar.
It’s that historical behavior can be turned into probabilities, and those probabilities can help you better understand the environment you’re trading or investing in.
What I Remember Most From Reading It
The biggest thing that stuck with me after reading The Little Book of Stock Market Cycles was seasonality.
Before reading this book, I understood that the market went through stronger and weaker periods, but I hadn’t spent much time thinking about whether those periods tended to occur during specific parts of the year.
One of the major ideas discussed in the book is the concept of the market having historically stronger and weaker six-month periods.
Broadly speaking, certain parts of the year have historically produced stronger returns, while other periods have experienced more weakness, volatility, or deeper corrections.
That does NOT mean you can simply buy stocks on one date, wait six months, and collect an easy profit every year. Markets don’t work that way, and even long-running seasonal patterns can fail.
What it showed me instead is that time itself can be treated as another variable in market research.
Month of the year, quarter, election year, earnings season, or even the number of hours following a catalyst can all become data points.
Market seasonality isn’t a crystal ball. It’s another source of historical data that can help you think about markets in terms of probabilities instead of predictions.
Check Out the Book →Santa Claus, January and Presidential Elections
The Little Book of Stock Market Cycles also introduced me to several market patterns that I had heard mentioned before but had never seriously researched.
The Santa Claus Rally and January Effect are two obvious examples, and Hirsch looks at the historical data behind these ideas instead of simply repeating old Wall Street sayings.
I also remember being particularly interested in the sections covering U.S. presidential elections and how the market has historically behaved during different stages of the election cycle.
Hirsch also examines historical market performance under different political parties and administrations.
Again, none of that means an election automatically determines whether stocks will rise or fall.
But what interested me was the methodology behind the research: take an event, collect decades of market data around it, and see whether a meaningful statistical tendency actually exists.
That’s a much more useful lesson than simply memorizing whether one particular month or election year has historically been bullish or bearish.
| President | Party | Years | Total Return | Annualized |
|---|---|---|---|---|
| Herbert Hoover | Republican | 1929–1933 | -62% | -23% |
| Franklin D. Roosevelt | Democrat | 1933–1945 | +198% | +9% |
| Harry Truman | Democrat | 1945–1953 | +87% | +8% |
| Dwight Eisenhower | Republican | 1953–1961 | +129% | +11% |
| John F. Kennedy | Democrat | 1961–1963 | +23% | +9% |
| Lyndon B. Johnson | Democrat | 1963–1969 | +43% | +6% |
| Richard Nixon | Republican | 1969–1974 | -27% | -6% |
| Gerald Ford | Republican | 1974–1977 | +40% | +12% |
| Jimmy Carter | Democrat | 1977–1981 | +28% | +6% |
| Ronald Reagan | Republican | 1981–1989 | +119% | +10% |
| George H.W. Bush | Republican | 1989–1993 | +51% | +11% |
| Bill Clinton | Democrat | 1993–2001 | +210% | +16% |
| George W. Bush | Republican | 2001–2009 | -40% | -6% |
| Barack Obama | Democrat | 2009–2017 | +182% | +14% |
| Donald Trump | Republican | 2017–2021 | +67% | +13% |
| Joe Biden* | Democrat | 2021–2024 | ~+40% | ~9–10% |
This Book Changed How I Think About Trading Research
This is probably the biggest reason I still recommend The Little Book of Stock Market Cycles.
The individual seasonal patterns are interesting, but the underlying research process ended up being more valuable to me than any one cycle Hirsch discusses.
You can take a specific market event, collect historical examples, measure what happened afterward, and eventually start turning those observations into probabilities.
That’s essentially what I’ve been doing with my own post-earnings momentum research on Paper Trading Journal.
I’ve been collecting earnings setups and measuring how stocks behave during the 24 to 48 hours following their initial earnings move.
Instead of assuming that a stock should continue higher after a strong report, I can measure things like maximum favorable excursion, maximum adverse excursion or potential risk, continuation rates, and how often certain profit targets or drawdowns occur.
The more examples I collect, the more useful that dataset becomes. Instead of asking, “What do I think this stock will do?” I can start asking, “What has historically happened when similar conditions occurred?”
That’s a completely different way of approaching trading, and it’s one of the biggest ideas I took away from Hirsch’s book.
Want to Think About Markets More Statistically?
Hirsch’s book is a useful introduction to seasonality, recurring market patterns, election cycles, and the idea of turning historical market behavior into probabilities.
Hardcover: about $7.88-$12.92
Paperback: about $51.09-$62.28
Who Should Read The Little Book of Stock Market Cycles?
I think The Little Book of Stock Market Cycles is best suited to traders and investors who already understand the basic mechanics of the stock market but want to develop a more analytical way of thinking about market behavior.
It’s especially useful if you’re interested in why certain recurring market tendencies are studied in the first place.
If you’re a day trader, don’t expect a book filled with intraday setups, chart patterns, or technical indicators. If you’re a long-term investor, don’t expect a guaranteed formula for outperforming the S&P 500 either.
What you get instead is an introduction to the idea that markets can be studied through recurring cycles, seasonal tendencies, historical events, and probabilities.
For newer traders especially, I think that’s valuable because it encourages you to stop thinking entirely in terms of predictions.
The Little Book of Stock Market Cycles: Pros & Cons
Hirsch’s book is strongest as an introduction to market seasonality, recurring cycles, and probability-based thinking, but it is not a step-by-step trading manual.
✅ Pros
- Explains market seasonality in an easy-to-understand way
- Introduces recurring patterns like the Santa Claus Rally and January Effect
- Encourages a more statistical approach to trading and investing
- Includes historical research on presidential and election cycles
- Useful for understanding probabilities rather than making predictions
- Relatively short and easy to work through
❌ Cons
- Not really a day trading book
- Does not provide a complete trading strategy
- Some seasonal patterns can weaken or change over time
- Historical tendencies are not guarantees of future performance
- Readers looking for chart setups or technical indicators may find it too broad
- Some of the data may feel dated compared with newer market research
Best for: traders and investors who want to understand market cycles, seasonality, and how historical data can be turned into probabilities.
Check Price on Amazon →Is The Little Book of Stock Market Cycles Worth Reading?
For me, yes. Not because The Little Book of Stock Market Cycles gave me a trading system that I could immediately start using, but because it changed the way I thought about collecting and analyzing market data.
The Little Book of Stock Market Cycles helped reinforce the idea that trading doesn’t have to be based entirely on opinions, predictions, or gut feelings.
You can collect data, test ideas, measure what actually happened, and use those results to build a better understanding of probabilities and risk.
That approach has directly influenced the way I now research post-earnings momentum and other trading setups on Paper Trading Journal.
In that sense, the book gave me something more useful than a single trading strategy: it gave me a framework for asking better questions.
My Final Thoughts – The Little Book of Stock Market Cycles
The Little Book of Stock Market Cycles isn’t going to give you a foolproof way to predict the stock market, and that’s not really the point.
What it can give you is a much better appreciation for how seasonality, recurring market events, historical cycles, and probabilities can be incorporated into your research.
Markets can feel completely random when you’re watching prices move minute by minute, but zoom out and collect enough data and sometimes patterns begin to appear.
The challenge isn’t simply finding a pattern; it’s figuring out whether that pattern is strong enough, consistent enough, and statistically meaningful enough to actually matter.
That’s probably the biggest lesson I took away from The Little Book of Stock Market Cycles, and it’s one that has had a real influence on how I approach my own trading research.
Add Market Cycles to Your Trading Library
If you want to better understand why traders study seasonality, election cycles, calendar effects, and historical probabilities, this is an easy book to add to your reading list.
Hardcover copies are currently available for roughly $7.88-$12.92.
Check Price & Availability on Amazon →As an Amazon Associate, Paper Trading Journal may earn from qualifying purchases.


Frequently Asked Questions
What is The Little Book of Stock Market Cycles about?
The Little Book of Stock Market Cycles by Jeffrey A. Hirsch explores recurring patterns in stock market performance, including seasonality, presidential election cycles, the Santa Claus Rally, the January Effect, and longer-term economic cycles. Rather than presenting these tendencies as guaranteed predictions, the book focuses on using historical market data to identify probabilities and recurring behaviors.
Who is Jeffrey Hirsch?
Jeffrey A. Hirsch is a market researcher, author, and longtime editor of the Stock Trader’s Almanac, a publication known for studying market seasonality and historical trading patterns. Much of his work focuses on analyzing decades of stock market data to determine whether certain calendar periods, political cycles, and recurring events have historically influenced market performance.
What is a stock market cycle?
A stock market cycle is a recurring pattern of expansion, strength, weakness, or decline that appears over time. Some cycles can last several years, such as bull and bear markets, while others involve shorter seasonal patterns measured over months, weeks, or even specific trading days.
Stock market cycles are not perfectly predictable. They are better viewed as historical tendencies that traders and investors can measure and compare with current market conditions.
What are the four stages of a stock market cycle?
Stock market cycles are commonly described using four broad stages: accumulation, markup, distribution, and markdown. Accumulation generally occurs as investors begin buying following a period of weakness, while markup represents the stronger upward phase of a bull market.
Distribution can occur when prices remain elevated but buying momentum begins weakening, followed by markdown as selling pressure pushes prices lower. These stages are useful for understanding longer market cycles, although real markets rarely transition between them perfectly.
What is stock market seasonality?
Stock market seasonality refers to historical patterns associated with particular times of the year. Researchers have found that some months, quarters, and six-month periods have historically produced different average returns than others.
That does not mean a particular month


Leave a Reply