

Using original PTJ research from 208 post-earnings momentum trades, we compare 3 exit strategies to determine how active stop-losses, profit targets, and passive end-of-day exits affect profitability, win rates, and risk. Discover why passive exits generated 26.5% more profit, how a −15% stop-loss strategy achieved a 56.7% win rate, and what an 8-trade losing streak and $1,109 maximum drawdown reveal about trading psychology and risk management.

Knowing when to sell a stock can be just as important as knowing when to buy it. Yet, many traders spend considerably more time identifying entry signals than developing consistent exit strategies.
Some traders use fixed stop-losses and profit targets, while others prefer trailing stops, technical indicators, or simply holding positions until a predetermined time.
But which stock exit strategy actually produces the best results?
To investigate, Paper Trading Journal (PTJ) analyzed 208 historical post-earnings momentum trading setups, comparing three exit strategies using consistent $1,000 position sizes.
The results suggest that passive exits can outperform active profit-taking, although they introduce additional risks that traders shouldn’t overlook.
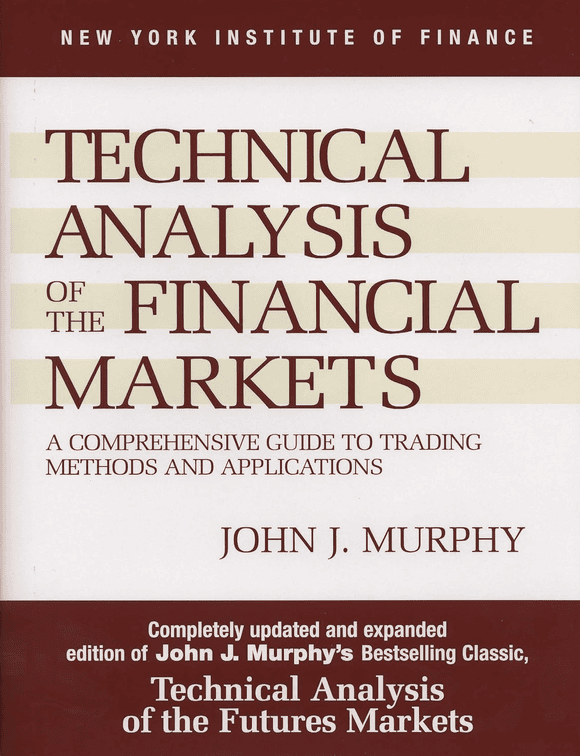
Learn the Fundamentals of Technical Analysis
John J. Murphy’s Technical Analysis of the Financial Markets covers charts, trends, indicators, candlesticks, intermarket relationships, and other core technical analysis concepts.
Price: $34.27–$35.50
View on Amazon →Quick Answer: What is the best exit strategy for stocks?
The best exit strategy for stocks depends on your trading system, but PTJ’s research suggests that passive end-of-day (EOD) exits can outperform active stop-loss and profit-target strategies. In a backtest of 208 post-earnings momentum trades, holding until the next day’s close generated a 56.7% win rate and $4,750 in profits, compared with a 51.4% win rate and $3,754 using a −5% stop-loss and +9% profit target. A hybrid strategy combining a −15% catastrophic stop-loss with passive EOD exits generated $4,405 in profits, a 56.7% win rate, and a maximum realized drawdown of $1,109. All results assume $1,000 positions before trading costs, demonstrating that allowing winning trades to run can improve profitability, although it also exposes traders to larger losses.
Active vs. Passive Stock Exit Strategies
208 post-earnings momentum trades | $1,000 per trade
| Exit Strategy | Total P/L | Win Rate | Avg. Return |
|---|---|---|---|
| Active: -5% SL / +9% PT | +$3,754 | 51.4% | +1.80% |
| Hybrid: -15% SL / EOD | +$4,405 | 56.7% | +2.12% |
| Passive: EOD Only HIGHEST P/L | +$4,750 | 56.7% | +2.28% |
Key Finding: Passive EOD exits generated approximately 26.5% more profit than the active -5% stop-loss / +9% profit-target strategy, but without intraday downside protection.
Source: PaperTradingJournal.com original research, 208 historical earnings momentum setups. Fixed $1,000 positions, no compounding. Hypothetical results exclude trading costs, slippage, and short-borrow fees. Past performance does not guarantee future results.
What Are the Different Stock Exit Strategies?
Most stock trading exit strategies fall into two broad categories: active and passive exits.
Active vs. Passive Exit Strategies
Two approaches to deciding when to close a stock position
Price-Based Decisions
Close a trade when a specific price condition or technical signal is reached.
Time-Based Decisions
Hold a position until a predetermined time or event, regardless of routine price fluctuations.
Across 208 post-earnings momentum setups, passive next-day EOD exits generated 26.5% more simulated profit than a fixed -5% stop-loss / +9% profit-target strategy. However, passive exits also exposed traders to larger potential losses.
Source: PaperTradingJournal.com original research. Hypothetical historical results, before trading costs.
Active vs. Passive Exit Strategies: A 208-Trade Backtest
To compare these approaches, PTJ examined 208 post-earnings momentum setups.
Each simulated trade entered at the close of the first hourly earnings reaction candle. Positions followed the initial earnings reaction, meaning bullish reactions were traded long and bearish reactions were traded short.
Three exit strategies were tested:
- Active exit: A −5% stop-loss, +9% profit target, and next-day end-of-day (EOD) exit if neither threshold was reached.
- Passive exit with protection: A −15% catastrophic stop-loss, otherwise holding until the next day’s close.
- Fully passive exit: Holding every position until the next day’s close without a stop-loss.
All simulations used fixed $1,000 positions without compounding.
Stock Exit Strategy Backtest Results
208 Earnings Momentum Setups | $1,000 Per Trade
| Exit Strategy | Total P/L | Avg. Return |
|---|---|---|
| -5% SL / +9% PT | +$3,754 | +1.80% |
| -15% SL / EOD | +$4,405 | +2.12% |
| EOD Only BEST P/L | +$4,750 | +2.28% |
Key Finding: Passive EOD exits generated 26.5% more profit than the -5% stop-loss / +9% profit-target strategy.
Source: PaperTradingJournal.com original research, 208 historical earnings momentum setups. Results are hypothetical, based on fixed $1,000 positions without compounding and before transaction costs, slippage, and short-borrow fees.
The fully passive strategy generated approximately 26.5% more profit than the active stop-loss and profit-target approach. Meanwhile, introducing a wider −15% catastrophic stop reduced total profits slightly, but provided an additional layer of risk protection.
This suggests that allowing profitable earnings momentum trades to continue developing can be more effective than automatically taking profits at a predetermined percentage.
However, higher profitability doesn’t necessarily mean lower risk.
How Do Exit Strategies Affect Win Rates?
Win rate is another important consideration when evaluating trading exits.
Across PTJ’s dataset, holding until EOD produced a 56.7% winning trade rate, compared with approximately 51.4% when using the −5% stop-loss and +9% profit target.
The −15% stop-loss and EOD strategy maintained a 56.7% win rate in the historical sample.
Although these differences may appear relatively small, they can meaningfully affect profitability over hundreds of trades.
For example, a trader taking profits too early might regularly capture 9% gains while missing subsequent rallies of 15%, 20%, or more. Conversely, holding trades too long can allow profitable positions to reverse into losses.
The optimal approach depends on how prices typically behave following the trader’s entry signals.

The Hidden Cost of Passive Exits: Drawdowns and Losing Streaks
One of the most important findings concerned the psychological difficulty of holding positions through adverse price movements. While it sounds easy to simply place a -15% stop-less and allow your trades to play themselves out, it’s much easier said than done.
For a new trader, watching a trade go against you by -15% can be devastating, even if it’s still within your pre-defined risk parameters. That’s why trading psychology and position sizing are crucial.
Not only to ensure losses don’t become disproportionately large.
But also to help they trader maintain control over their mental state during a trade, and not make unplanned discretionary choices that can often turn trading into gambling.
Trading Strategy Risk & Drawdown Statistics
208 Earnings Momentum Trades | -15% Stop-Loss + Next-Day EOD Exit
| Risk Metric | Result |
|---|---|
| Winning Trades | 118 |
| Losing Trades | 86 |
| Breakeven Trades | 4 |
| Maximum Realized Drawdown | -$1,109 |
| Longest Consecutive Losing Streak | 8 Trades |
| Loss During Worst Streak | -$700 |
| Trades Reaching the -15% Stop | 16 |
| Profit Factor | 1.75 |
Key Finding: Despite generating $4,405 in simulated profits, the strategy experienced a $1,109 maximum realized drawdown and 8 consecutive losing trades. Even profitable systems can experience substantial periods of underperformance.
Source: PaperTradingJournal.com original research. 208 historical post-earnings momentum setups, fixed $1,000 positions, -15% catastrophic stop-loss and next-day EOD exits. Hypothetical results exclude transaction costs, slippage, and short-borrow fees. Drawdown is based on sequential realized trade P/L, not intraday portfolio equity.
These results assume $1,000 positions throughout. Despite generating $4,405 in hypothetical profits, the strategy experienced a peak-to-trough decline exceeding $1,100 in cumulative realized P/L.
That’s significant for a trader operating with a relatively small account.
The worst losing streak also involved eight consecutive losing positions, demonstrating how even a historically profitable strategy can experience extended periods of frustration.
Importantly, these drawdown figures measure completed trades rather than the maximum intraday decline of an actual portfolio.
Final Thoughts: Which Exit Strategy Is Best?
PTJ’s research suggests that passive exits deserve serious consideration, particularly when trading stocks following significant earnings announcements.
Across 208 historical setups, holding until the next day’s close generated the highest total profit, while a wider −15% catastrophic stop provided some downside protection with a relatively modest reduction in simulated returns.
Nevertheless, these results are specific to one post-earnings momentum dataset. They do not establish that passive exits universally outperform active trading.
Ultimately, traders should evaluate exit strategies using historical data, position sizing, maximum drawdown, and personal risk tolerance rather than relying exclusively on win rates or profit targets.
Learn the Fundamentals of Technical Analysis
John J. Murphy’s Technical Analysis of the Financial Markets covers charts, trends, indicators, candlesticks, intermarket relationships, and other core technical analysis concepts.
Price: $34.27–$35.50
View on Amazon →If you want to go deeper:
- Explore the Trading Statistics Hub to understand how different sectors behave across market cycles
- Study real setups inside the Trade Reviews section
- Learn the framework behind high-probability setups in the Post-Earnings Momentum Strategy
This is how you turn raw market data into repeatable trading edge.
More Trading Statistics…


Frequently Asked Questions
What is the best exit strategy for stocks?
The best stock exit strategy depends on the trader’s objectives, risk tolerance, and historical performance data. In PTJ’s backtest of 208 post-earnings momentum trades, passive next-day end-of-day (EOD) exits generated the highest profits, producing $4,750 from fixed $1,000 positions, with a 56.7% win rate and an average return of 2.28% per trade. By comparison, an active strategy using a −5% stop-loss and +9% profit target generated $3,754, approximately 21% less than the passive approach. However, passive exits also exposed positions to greater downside risk.
What are the best strategies for exiting stocks?
Popular exit strategies include fixed stop-losses, take-profit orders, trailing stops, technical indicator exits, time-based exits, and hybrid approaches. PTJ compared three strategies across 208 earnings momentum setups: an active −5% stop-loss/+9% profit target, a hybrid −15% stop-loss/EOD exit, and a fully passive EOD exit. Their respective average returns were 1.80%, 2.12%, and 2.28% per trade. The results suggest that allowing trades more room to develop can improve returns in certain momentum-based systems, although no single strategy is universally superior.
Is it better to take profits early or let winning stocks run?
Letting winning stocks run produced higher overall returns in PTJ’s historical earnings momentum sample. Taking profits at +9%, combined with a −5% stop-loss and EOD fallback, generated $3,754 across 208 trades. Holding until EOD without a profit target generated $4,750, an additional $996, or approximately 26.5% more profit relative to the active strategy. This illustrates how fixed profit targets can limit upside when stocks continue moving favorably after reaching an initial price objective. However, holding longer also creates opportunities for profitable positions to reverse.
What is a good stop-loss percentage for stock trading?
There is no universally optimal stop-loss percentage. PTJ tested a −5% stop-loss paired with a +9% profit target against a wider −15% catastrophic stop paired with EOD exits. The wider-stop strategy generated $4,405 in simulated profits, compared with $3,754 for the active strategy, a difference of $651, or approximately 17.3%. Only 16 of the 208 trades, representing 7.7% of the sample, reached the −15% stop. However, a −15% loss on a $1,000 position represents $150, compared with just $50 at a −5% stop. Traders must balance the benefits of avoiding premature exits against the increased financial risk of wider stops.
Do stop-loss orders reduce trading profits?
Stop-loss orders can reduce profits when positions temporarily decline before recovering. In PTJ’s 208-trade backtest, the fully passive EOD strategy generated $4,750, while the same strategy incorporating a −15% catastrophic stop generated $4,405. That represents $345 in foregone profits, or approximately 7.3% of the unrestricted EOD strategy’s total return. The wider stop was triggered 16 times, and nine of those positions subsequently recovered enough to finish above the −15% threshold. Although this particular dataset favored fewer stop-loss interventions, stops can provide essential protection against unusually large losses.
What is a good win rate for a stock trading strategy?
A profitable trading strategy does not necessarily need a win rate above 60% or 70%. Profitability depends on the relationship between average winning and losing trades. In PTJ’s research, the −15% stop-loss/EOD strategy produced 118 winners, 86 losers, and four breakeven trades, resulting in a 56.7% win rate and a 1.75 profit factor. This means the strategy generated approximately $1.75 in gross profits for every $1.00 lost. The more active −5%/+9% strategy produced a lower 51.4% win rate but remained profitable, demonstrating that win rate alone cannot determine whether a trading system has a positive expectancy.
How much money can traders lose during a drawdown?
Even historically profitable trading systems can experience substantial drawdowns. PTJ’s −15% stop-loss/EOD strategy generated $4,405 in simulated profits across 208 trades using fixed $1,000 positions, but experienced a maximum realized peak-to-trough drawdown of $1,109. That decline would represent approximately 22.2% of a hypothetical $5,000 starting account or 11.1% of a $10,000 account. The strategy’s largest consecutive losing streak consisted of eight trades, producing approximately $700 in combined losses. These figures measure sequential realized trading results rather than an actual portfolio’s intraday equity fluctuations.
How many losing trades in a row should day traders expect?
Consecutive losses are unavoidable in trading, even with a profitable system. In PTJ’s 208-trade backtest, the longest losing streak was eight consecutive trades, producing approximately $700 in losses with $1,000 positions. The strategy also experienced seven-trade and five-trade losing streaks
References
Paper Trading Journal. (n.d.-a). Post-earnings momentum database. https://papertradingjournal.com/post-earnings-momentum-database/
Paper Trading Journal. (n.d.-b). Stock chart setup case studies. https://papertradingjournal.com/stock-chart-setup-case-studies/
Paper Trading Journal. (n.d.-c). Trading statistics. https://papertradingjournal.com/trading-statistics/


Leave a Reply