

No matter how smart someone is, nobody can predict the next stock market crash. Andrew Ross Sorkin’s Too Big to Fail makes the 2008 financial crisis feel less like a line on a stock chart and more like a chain reaction inside the world’s financial system. This book review explains why the book matters to traders, then compares the warning signs of 2007–09 with the market as of September 25, 2026: Treasury yields, valuations, earnings expectations, volatility, gold, oil, and the fate of six financial stocks.

Is the stock market ready to crash? Is it time to sell your stocks or should you be buying more?
It’s truly hard to say.
But the fact remains that there are some serious signs of trouble in global markets. That does NOT mean everybody should cash out their investments and run for the hills.
I’ll start out by saying that there are some numbers that give traders and investors reasons to examine risk.
In fact, Treasury yields and valuations have seemed somewhat stretched lately, especially compared to how things looked before the Great Financial Crisis, but even that doesn’t tell us whether a crash is coming any time soon.
Let’s take a quick look…
Are Today’s Market Warning Signs Similar to 2007?
Three numbers investors are watching as they weigh the risk of another major market decline.
4.67% near the market’s October 2007 peak
Its highest level since 2007
20.68 in October 2007
What these numbers mean: Borrowing costs and valuations deserve attention, but matching or exceeding a 2007 reading does not predict when, or whether, the next crash will occur.
Sources: Federal Reserve, 10-year yield; Federal Reserve, 30-year yield; Multpl, S&P 500 trailing P/E.
Andrew Ross Sorkin’s Too Big to Fail offers a closer look at what made the 2008 crisis so devastating.
After reading it, I better understood how mortgage losses spread through major financial institutions, disrupted their funding, and threatened the wider economy.
The danger was not simply falling stock prices. It was a breakdown in trust between institutions that depended on one another to keep money moving.
In this article, I’ll connect the lessons found in Too Big To Fail to today’s market.
We’ll compare Treasury yields, valuations, earnings expectations, the VIX, gold, and oil with their precrisis readings, then look at how six financial stocks fared during and after 2008.
Quick Answer: Is the stock market expected to crash soon?
Nobody can reliably tell from today’s bond yield, valuation, or VIX reading whether the stock market is about to crash. As of September 25, 2026, high Treasury yields, meaningful valuation risk, and expensive oil deserve attention, but they do not establish that a repeat of 2008 is imminent. Too Big to Fail is valuable because it shows what a genuine systemic crisis looks like when losses, leverage, funding pressure, and fear reinforce one another.

Too Big to Fail Review: Why This Book Changed How I See Market Crashes
After reading Too Big to Fail, I walked away with a much better understanding of the Great Financial Crisis and why it was such a big deal.
I had known the outline: bad mortgages, Lehman Brothers, bailouts, and a brutal bear market. Andrew Ross Sorkin, the book‘s author, made me think about the people and institutions trying to keep money moving while each new failure threatened the next firm.
Too Big to Fail follows the executives, regulators, and government officials at the centre of the 2008 crisis. Its greatest strength is showing how trouble at one institution can spread quickly to its lenders, trading partners, customers, and the wider credit system.
The thing that really stuck with me is that big banks do not operate in isolation.
They hold deposits, fund loans, clear trades, and owe money to other institutions. When several major firms come under pressure at once, credit can freeze and losses can spread far beyond Wall Street.
That changed how I think about bank stocks like JPMorgan Chase (JPM), Goldman Sachs (GS), Morgan Stanley (MS), Bank of America (BAC), Wells Fargo (WFC), and Charles Schwab (SCHW).
How Much Have Major Financial Firms Grown Since 2007?
Market capitalization in billions of U.S. dollars. Each bar uses the same $0–$1,000 billion scale.
Important: Market cap is share price multiplied by shares outstanding. These bars show how company valuations changed, not what a 2007 shareholder earned. Acquisitions, share issuance, buybacks, and dividends affect that distinction.
Source: CompaniesMarketCap market-cap histories for JPM, GS, MS, BAC, WFC, and SCHW. The 2007 figures are year-end values; the 2026 figures are the available September 2026 snapshot, not year-end values.
Their businesses and exposure to the crisis differed, and they were not all equally close to failure. But what matters is how deeply these major financial institutions depend on one another.
The book also complicated my view of government bailouts.
I understand the anger over using public resources to support firms that helped create the crisis. I also truly believe that executives and major shareholders should face consequences for taking bad risks, especially when they lead to such massive disruptions.
But a disorderly collapse across the banking system could have harmed taxpayers, workers, and businesses even more. We cannot know precisely what every unmade rescue would have cost. But the risk of a broader credit freeze was very real leading up to 2008-2009.
According to the U.S. Treasury, its TARP bank investment programs recovered $275.9 billion through repayments and other income against $245.5 billion invested as of September 30, 2023.
What Did the TARP Bank Programs Recover?
$30.4B more recovered than invested
TARP bank investment programs only, as of September 30, 2023. This does not measure the full economic cost of the financial crisis. Source: U.S. Treasury
That does not erase the crisis’s economic damage or mean every rescue made money. But it does show that a bailout was not necessarily money permanently lost. (U.S. Treasury)
Overall, throughout Too Big To Fail, Sorkin tells a compelling story about global finance. But I will say that it’s a relatively dense book and the 640-page paperback also asks for a substantial time commitment.
But it’s still a book that I strongly recommend for traders and investors looking to deepen their knowledge of market behavior.
On the other hand, this is not a book of trading setups or entry signals. I recommend it because the book explains liquidity, counterparty risk, and panicked market behaviour that a stock chart alone cannot.
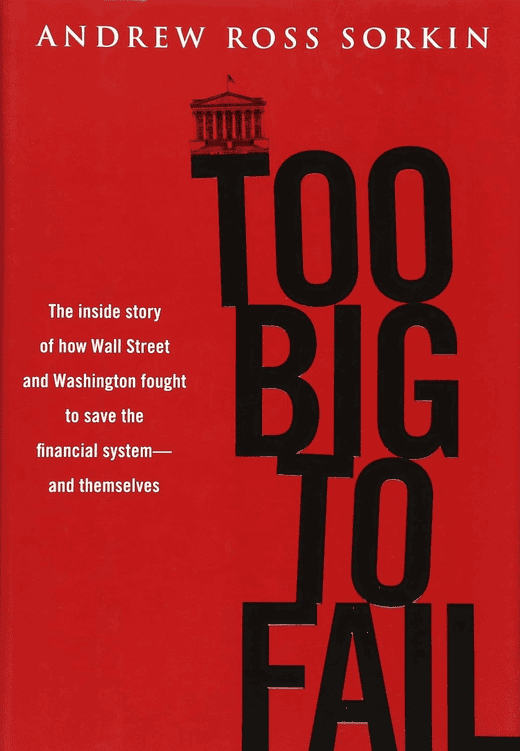
The Inside Story of the 2008 Crisis
$11.48–$34.22 on Amazon · Price varies by edition and seller.
View Too Big to Fail on AmazonIs the Stock Market Expected to Crash in 2026–2027?
A market crash or correction is possible in any year, but an exact prediction is a different claim.
By late September 2026, investors faced high borrowing costs and energy prices, but analysts still expected strong earnings growth.
A selloff could come from disappointing profits, rising yields, an oil shock, credit losses, or an event nobody has identified yet. But the question for traders is not whether a familiar indicator matches 2007.
It’s whether several weaknesses are interacting and whether financial institutions can continue funding themselves and serving customers.
The comparison below uses October 9, 2007, near the S&P 500’s precrisis high, for Treasury yields; October 2007 for trailing P/E; the 2008 crisis peak where noted; and the latest cited September 2026 observations.
These are deliberately labeled because mixing a precrisis snapshot with a crisis peak can create a false “then versus now” story. Historical prices are nominal U.S. dollars and are not adjusted for inflation.
Treasury Yields and Credit Stress: 2007 vs. 2026
Similar bond yields do not necessarily point to the same kind of financial crisis.
| Indicator | Before or During 2008 | Latest Cited 2026 Reading | What It Tells Us |
|---|---|---|---|
| 10-Year Treasury Yield |
4.67% Oct. 9, 2007 |
5.18% Sep. 24, 2026 |
Higher yields can raise borrowing costs and pressure stock valuations. The yield alone does not diagnose a banking crisis. |
| 10-Year Minus 2-Year Yield |
+0.52 percentage points Oct. 9, 2007, after an earlier inversion |
+0.36 percentage points Sep. 25, 2026 |
A positive spread today does not erase concerns raised by an earlier inversion. |
| Credit and Funding Stress | Mortgage securities deteriorated. Short-term funding and confidence broke down during 2008. | Watch bank funding, deposit flight, credit losses, and lending standards. | Stress in the financial system matters more than matching one historical Treasury yield. |
Sources: FRED 10-year Treasury yield, FRED 10-year minus 2-year spread, and the Federal Reserve’s 2008 banking review.
Before 2008, the yield curve had inverted and then steepened as the Federal Reserve cut short-term rates. A steeper curve during the crisis was hardly an all-clear signal.
Similarly, today’s 10-year yield above 5% may reflect inflation and interest-rate pressure, not the same mortgage-credit chain reaction.
That’s why it’s important to compare why yields moved, the cost of bank funding, and the condition of borrowers before treating “yields are back near 2007 levels” as a crash forecast.
Valuations and Growth Expectations: What Is Priced In?
A higher valuation leaves more room for disappointment if expected earnings growth fails to arrive.
| Measure | 2007–09 | September 2026 | Reading for Traders |
|---|---|---|---|
| S&P 500 Trailing P/E |
20.68 Oct. 1, 2007 |
Estimated 26.40 Sep. 25, 2026 |
The 2026 market carries a higher valuation on this measure. The latest figure is an estimate. |
| Expected Earnings Growth | Optimistic forecasts proved vulnerable as credit and demand weakened in 2008–09. | FactSet projected 24.5% S&P 500 earnings growth for calendar-year 2026. | Forecasts are not realized profits. Watch earnings revisions and whether growth is concentrated in a few sectors. |
| What Could Break the Thesis? | Mortgage losses, falling confidence, and impaired credit. | Weak earnings delivery alongside high rates or tighter credit. | Valuation is a risk factor, not a crash timer. |
Sources: Multpl trailing P/E series and FactSet Earnings Insight. The P/E figures use trailing reported earnings; the growth figure is a forward-looking estimate.
When a market is priced for rapid growth, even a modest change in expectations can trigger a large repricing.
But expensive does not tell us when a decline will happen.
A practical watch list includes earnings revisions, profit margins, job growth, lending conditions, and how much of the index’s expected growth depends on a small number of companies.
VIX, Gold, and Oil: Three Different Kinds of Signal
These markets can reveal stress, but none provides a reliable countdown to a stock market crash.
| Indicator | Before or During the Crisis | 2026 Context | What Not to Assume |
|---|---|---|---|
| VIX | Rose into the 20s and 30s during stretches of 2007. It reached a daily peak of 80.86 on Nov. 20, 2008. | 14.21 on Sep. 22, 2026, the latest clearly verified reading used here. | A quiet VIX reflects option-implied near-term volatility. It does not prove that longer-term risk has disappeared. |
| Gold | Rose over the broad 2007–08 period, but also swung sharply when investors needed cash. | Around $4,000–$4,300 per ounce in late September 2026, depending on the date and quote. | Gold responds to inflation, currencies, policy, geopolitics, and demand. A high nominal price is not a crash countdown. |
| WTI Crude Oil | Reached about $145 per barrel on July 3, 2008, then plunged as demand weakened. | Around $95–$100 per barrel in late September 2026. | An oil spike can squeeze consumers and profit margins, but its cause and duration matter more than the price alone. |
Sources: FRED VIX series and 2008 VIX peak; World Gold Council and Kitco gold prices; EIA July 2008 report and EIA WTI history. Gold and oil figures are approximate ranges from different dates, not synchronized daily closes.
So yes, it’s true that there are some warning signs flashing red in today’s macro and geopolitical environments. But no signal can predict an impending crash, even if they’re similar to before the 2008-2009 Financial Crisis.
The crucial takeaway is that the VIX did not need to be at 80 for trouble to be developing in 2007, and the oil peak in 2008 happened after the stock market’s 2007 high.
Looking backward at their extremes and calling them advance warning signals would be hindsight.
For today’s traders and investors, it’s important to watch whether rising volatility is accompanied by widening credit stress and a deterioration in earnings, rather than relying on any single threshold.
Are Banks Today Facing the Same Risks as in 2008?
Sorkin’s Too Big To Fail explains why I watch bank stocks differently from other stocks.
Deposits and short-term borrowing can move faster than a loan book can be sold. If counterparties lose confidence, even an institution with valuable assets can face a liquidity emergency.
In 2008, falling mortgage values, opaque exposures, leverage, and funding pressure collided. Lehman Brothers filed for bankruptcy, while Washington Mutual and IndyMac Bank failed. JPMorgan Chase acquired Bear Stearns and Washington Mutual’s banking operations, and Bank of America acquired Merrill Lynch.
On another note, the regulatory and institutional framework has changed since then, and the FDIC’s first-quarter 2026 report recorded $80.5 billion in aggregate net income and a 1.26% return on assets for FDIC-insured institutions.
Those figures do not guarantee that every bank is healthy or rule out future trouble. But they do show that the industry was profitable in that quarter, which is one reason today’s conditions should not be treated as a direct replay of 2007.
The more important questions worth following are capital, uninsured deposits, credit quality, losses on securities and loans, access to funding, and interbank or counterparty stress. (FDIC)
What Happened Behind the Headlines?
Lehman Brothers went bankrupt. Washington Mutual failed. Bear Stearns, Merrill Lynch, and Wachovia were absorbed by other firms. In Too Big to Fail, Andrew Ross Sorkin takes readers inside the decisions made as each shock threatened to spread through the financial system.
A compelling read for anyone who wants to understand why the 2008 crisis became much bigger than a stock market selloff.
$11.48–$34.22 on Amazon · Price varies by format and seller.
Read Too Big to FailSix Financial Stocks: Before, During, and Years After the Crisis
A stock that survived 2008 was not necessarily an easy hold.
Shareholders faced huge drawdowns, dividend cuts, dilution, and years of uncertainty.
The table below is a case study timeline, not a ranking of historical investment returns: the six companies have different business models, and comparing raw share prices across splits and corporate actions can be misleading.
| Company | Before the crisis | During 2008–09 | 2008–09 low* | Sept. 28, 2026 quote | What happened afterward |
|---|---|---|---|---|---|
| JPMorgan Chase (JPM) | Large diversified bank. | Acquired Bear Stearns and Washington Mutual’s banking operations. | ~$9.77 | $343.06 | Expanded its footprint, though the acquisitions brought substantial risks. |
| Morgan Stanley (MS) | Standalone investment bank. | Faced severe funding pressure and became a bank holding company. | ~$8.93 | $196.31 | Survived and reshaped its business. Its shares did not recover immediately. |
| Goldman Sachs (GS) | Standalone investment bank. | Faced funding stress and became a bank holding company. | ~$34.84 | $935.45 | Remained a major firm under a different funding and regulatory structure. |
| Bank of America (BAC) | Major consumer and commercial bank. | Acquired Merrill Lynch and received government support. | ~$1.92 | $56.70 | Survived, but mortgage losses, capital needs, and dilution complicated shareholders’ recovery. |
| Wells Fargo (WFC) | Large deposit-taking bank. | Acquired Wachovia during the turmoil. | ~$5.03 | $82.97 | Grew through acquisition while taking on additional exposures. |
| Charles Schwab (SCHW) | Brokerage and banking business. | Fell with financial stocks but was not a Lehman-style investment-bank failure. | ~$8.80 | $99.03 | Shows why financial firms should be assessed by their individual business and balance-sheet risks. |
*Approximate adjusted intraday lows recorded in 2008 or 2009. The September 28, 2026 figures are market quotes checked at approximately 12:42–12:50 UTC and can change. Adjusted historical prices and current quotes use different conventions, so their difference is not an investor return. Historical price source: StatMuse.
What happened to investors who held on?
All six stocks trade well above the crisis-period lows shown here. For long-term investors who bought and held these surviving firms, the recovery could have been substantial.
Those lows were only obvious in hindsight, and some financial firms never recovered. These prices do not show an investor’s percentage return. Dividends, share issuance, and the timing of a purchase would also change the outcome.
Is a Market Crash the Best Time to Buy Stocks?
A severe market correction or crash can create outstanding long-term entry points for assets that survive and eventually recover.
In hindsight, early 2009 was one of the most attractive times in the past two decades to buy a diversified basket of U.S. stocks.
However, it did not feel attractive while layoffs, bank failures, and forced selling were still unfolding.
| S&P 500 milestone | Index level | What an investor experienced |
|---|---|---|
| October 2007 precrisis high | 1,565.15 | Optimism before a prolonged market decline. |
| March 2009 crisis low | 676.53 | About 57% below the 2007 high, excluding dividends. |
| March 2013 recovery | 1,569.19 | Finally surpassed its 2007 closing high after more than five years. |
| September 25, 2026 close | 7,743.41 | About 1,045% above the March 2009 low on a price-only basis. This assumes buying at the exact low and excludes dividends. |
S&P 500 price-index closing levels; dividends and inflation are excluded. The September 25, 2026 close is the latest completed trading-day figure used here. Sources: FRED S&P 500 series and historical closing milestones.
So what exactly can we learn from all this?
Well, first off, the index levels shown above show prices, not total returns. They also make the 2009 low look easier to act on than it was: no one knew in March 2009 that the market had bottomed.
That is why I favor a long-term investing plan over trying to buy every dip.
Dollar-cost averaging means investing a set amount regularly, buying more shares when prices fall and fewer when they rise. It cannot prevent losses, but it reduces the need to guess the turning point.
Diversification matters too: an individual bank stock may fail or take years to recover, while a broad index can change its holdings over time. (Investor.gov)
So the most important lesson is to keep money you need soon aligned with a shorter time horizon.
An emergency fund and manageable risk matter more than a prediction about the next crash. Active traders also need risk limits that let them survive a crisis.
That is a different decision from making regular contributions to a long-term portfolio.
Recommended reading for traders and investors
The next market crisis won’t arrive with a clear warning label.
Too Big to Fail takes you inside the decisions that defined 2008. Andrew Ross Sorkin follows the collapse of Lehman Brothers, the scramble to rescue other institutions, and the loss of confidence that spread through the financial system.
If you follow bank stocks or worry about the next crash, this book helps explain why trouble at one firm can quickly become a problem for the entire market.
$11.48–$34.22 on Amazon
Price varies by edition and seller.
Conclusion: What Too Big to Fail Teaches Investors
Too Big to Fail did not give me a formula for predicting market corrections or crashes.
It gave me a clearer picture of how confidence, funding, leverage, and connected institutions can turn a financial problem into an economic emergency.
That makes it an excellent trading book recommendation for anyone who wants to understand global finance, market behaviour, and the interconnectedness of it all beyond a price chart.
Ultimately, it’s true that the market of September 2026 has some uncomfortable features: high rates, a richer trailing P/E than in October 2007, and lofty earnings expectations.
But it also has different regulations, bank structures, and a different set of potential shocks affecting the broader market.
It’s good to understand history and to look to it for answers, but no matter how hard we look, it’s best to avoid pretending that anyone knows the exact date of the next stock market crash.


Frequently Asked Questions
Is the stock market expected to crash soon?
There is no reliable countdown. As of September 25, 2026, higher yields and valuation risk justify preparation, but the cited indicators do not prove an imminent crash. Monitor earnings revisions, credit stress, and bank funding together.
Should I pull my money out of the stock market?
That depends on when you need the money, your emergency savings, diversification, and tolerance for a steep loss. A long-term investor with a sound allocation may choose to keep contributing through volatility; someone with near-term spending needs may need less stock exposure. Avoid an all-or-nothing decision based solely on a crash headline.
Is the stock market expected to crash again?
Another major decline will occur at some point, but its timing, cause, and depth are unknown. Markets have repeatedly experienced bear markets; “eventually” is not a useful forecast for 2026 or 2027.
What are the odds of a stock market crash?
An honest probability requires a time period and a definition, such as a 20% decline within 12 months. Historical frequencies can describe the past but cannot produce a dependable personalized probability for the next year, especially when the source of the next shock may differ from 2008.
Do high Treasury yields mean a crash is coming?
No. Yields can rise with inflation, economic growth, or expectations about central-bank policy. They can weigh on borrowing and stock valuations, but a systemic crash also depends on credit losses, leverage, liquidity, and confidence.
Why did bank stocks behave differently in 2008?
They had different mortgages, funding sources, capital, counterparties, and acquisition decisions. Schwab’s brokerage-led business, for example, should not be treated as identical to the standalone investment banks Morgan Stanley and Goldman Sachs.
Did taxpayers lose money on the bank bailouts?
The answer depends on which program and which costs you include. Treasury says its TARP bank investment programs recovered more than they invested by September 2023. That narrow accounting does not measure the full economic cost of the crisis or settle the debate over how the rescue was designed.
Is Too Big to Fail a good book for traders?
Yes, if you want context on systemic risk, market psychology, liquidity, and how institutions respond under pressure. It is a financial-crisis narrative, not a technical-analysis manual or a trading strategy.
References
Board of Governors of the Federal Reserve System. (2009). Profits and balance sheet developments at U.S. commercial banks in 2008. https://www.federalreserve.gov/pubs/bulletin/2009/articles/bankprofit/
Board of Governors of the Federal Reserve System. (2008, September 22). Board announces that Goldman Sachs and Morgan Stanley transactions may be consummated immediately. https://www.federalreserve.gov/newsevents/pressreleases/orders20080922a.htm
Federal Deposit Insurance Corporation. (2026). Quarterly banking profile: First quarter 2026. https://www.fdic.gov/quarterly-banking-profile/quarterly-banking-profile-q1-2026
Federal Reserve Bank of St. Louis. (n.d.). Market yield on U.S. Treasury securities at 10-year constant maturity [DGS10] [Data set]. FRED. Retrieved September 28, 2026, from https://fred.stlouisfed.org/series/DGS10
Federal Reserve Bank of St. Louis. (n.d.). 10-year Treasury constant maturity minus 2-year Treasury constant maturity [T10Y2Y] [Data set]. FRED. Retrieved September 28, 2026, from https://fred.stlouisfed.org/series/T10Y2Y
FactSet. (2026). Earnings Insight. https://www.factset.com/earningsinsight
Multpl. (n.d.). S&P 500 P/E ratio by month [Data set]. Retrieved September 28, 2026, from https://www.multpl.com/s-p-500-pe-ratio/table/by-month
Sorkin, A. R. (2009). Too big to fail: The inside story of how Wall Street and Washington fought to save the financial system—and themselves. Viking.
U.S. Department of the Treasury. (n.d.). Bank investment programs. Retrieved September 28, 2026, from https://home.treasury.gov/data/troubled-assets-relief-program/bank-investment-programs
U.S. Energy Information Administration. (2008, July). Short-term energy outlook. https://www.eia.gov/outlooks/steo/archives/jul08.pdf
U.S. Securities and Exchange Commission. (n.d.). Don’t panic, plan it! Investor.gov. https://www.investor.gov/additional-resources/spotlight/formerdirectorlorischock-directors-take/dont-panic-plan-it
World Gold Council. (n.d.). Gold spot prices [Data set]. Retrieved September 28, 2026, from https://www.gold.org/goldhub/data/gold-prices


Leave a Reply