

In this article, you’ll learn how much trading volume moves through U.S. equity markets each day, how activity is divided between major exchanges and off-exchange venues, how much volume may be driven by algorithmic trading, and why volume often rises during periods of elevated volatility. We’ll also explain how traders use volume to evaluate liquidity, confirm breakouts, identify unusual market participation, and understand whether increasing trading activity may precede significant price movements.

Understanding the relationship between a stock price and trading volume is essential for traders, investors, and analysts who want to gauge market activity and liquidity.
Trading volume reflects how many shares change hands on a stock exchange within a given period and is often used as a proxy for market participation, momentum, and investor sentiment.
In 2026, U.S. stock exchanges continue to dominate global equity trading, with trillions of dollars in securities traded every month across major venues such as the New York Stock Exchange and the NASDAQ.
These exchanges collectively account for a massive share of global equity liquidity, making U.S. stock exchange volume statistics one of the most closely watched metrics in financial markets.
Below, we examine key exchange volume statistics, recent trends in U.S. trading activity, and what the numbers reveal about the evolving structure of modern financial markets.
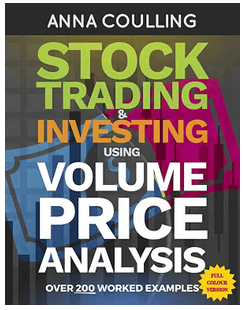
Stock Trading & Investing Using Volume Price Analysis
✓ Strong for pattern recognition
✓ Easy-to-understand volume concepts
✗ Not a complete trading strategy
✗ Heavy reliance on chart examples
Average Daily Trading Volume on U.S. Exchanges
One of the most important exchange volume statistics is average daily trading volume (ADV). This metric represents the average number of shares traded per day across exchanges.
According to data published by the Securities Industry and Financial Markets Association, U.S. equity markets regularly process between 10 and 12 billion shares per day in recent years.

During periods of heightened volatility, daily trading volume can surge far beyond these averages.
For example:
- Typical daily share volume: ~10–12 billion shares
- Peak volatility days: 20+ billion shares traded
- Average daily dollar volume: Often exceeds $500 billion
These exchange volume statistics demonstrate the immense liquidity of U.S. markets. High liquidity allows investors to enter and exit positions quickly without significantly impacting prices.
Liquidity is one reason global investors frequently trade U.S. equities rather than smaller international markets. Large trading volume reduces transaction costs and improves price discovery across thousands of publicly listed companies.
NYSE vs NASDAQ Trading Volume
While many investors think of a single U.S. stock market, trading activity is actually split across multiple exchanges. The two largest are the NYSE and NASDAQ, which together handle the majority of listed equity trading.
The New York Stock Exchange is traditionally home to many large-cap industrial and financial companies. Meanwhile, the NASDAQ is known for its heavy concentration of technology firms.
Exchange volume statistics show that NASDAQ often leads in share volume due to the high trading activity of tech stocks.
Typical Breakdown of U.S. Trading Volume
U.S. equity trading is split across major exchanges and off-exchange venues.
| Exchange / Venue | Share of U.S. Trading Volume |
|---|---|
| NASDAQ | ~45–50% |
| NYSE | ~20–25% |
| Other Exchanges & Dark Pools | ~25–35% |
Much of the remaining volume occurs on alternative trading systems and off-exchange venues, reflecting the increasingly fragmented nature of modern equity markets.

Off-Exchange Trading Volume
Another important category in exchange volume statistics is off-exchange trading, which occurs outside traditional public exchanges.
Data from the Financial Industry Regulatory Authority shows that approximately 40–45% of U.S. equity trading volume now occurs off-exchange through venues such as:
- Dark pools
- Internalization by market makers
- Alternative trading systems
This shift has been driven partly by high-frequency trading firms and large institutional investors seeking to minimize market impact when executing large orders.
While off-exchange trading improves execution for some investors, critics argue that it can reduce transparency and fragment liquidity across too many venues.
Algorithmic Trading and Market Volume
Algorithmic trading plays a major role in modern stock exchange volume statistics. Computer-driven strategies now execute a significant portion of daily trades across U.S. financial markets.

Research from firms such as JPMorgan and TABB Group suggests that algorithmic trading accounts for roughly 60–75% of equity trading volume in the United States.
These automated systems analyze market data and execute orders in milliseconds.
Algorithmic strategies are commonly used for:
- Market making
- Arbitrage opportunities
- Statistical trading models
- High-frequency trading (HFT)
Although algorithmic trading has significantly increased market efficiency, it has also raised concerns about flash crashes and extreme volatility.
Volatility and Volume Surges
Trading volume often spikes during periods of economic uncertainty or major news events. Earnings announcements, central bank decisions, and geopolitical developments can all cause sudden surges in trading activity.
For example, during major market stress events, daily U.S. equity trading volume has exceeded 25 billion shares, more than double typical levels.
These spikes occur because both institutional and retail investors rush to reposition portfolios when new information enters the market.
Higher trading volume during volatile periods is often accompanied by:
- Wider bid-ask spreads
- Increased price swings
- Elevated options trading activity
Traders often monitor these exchange volume statistics closely, as unusually high volume can signal the start of major market trends.
Exchange Volume Growth Over Time
Over the past two decades, U.S. equity trading volume has grown dramatically due to several structural changes in financial markets.

Rise of retail trading
Platforms such as Robinhood Markets and Charles Schwab Corporation have made stock trading more accessible than ever. Commission-free trading has encouraged millions of new investors to participate in markets.
Algorithmic trading adoption
The widespread use of automated trading systems has dramatically increased the number of orders executed each day.
Market fragmentation
Since the implementation of Regulation National Market System, trading volume has spread across multiple exchanges and alternative venues, creating a highly interconnected market ecosystem.
As a result, the total number of shares traded in U.S. markets today is several times higher than it was in the early 2000s.
Can Volume Tip You Off Before a Stock Starts Moving?
Price tells you what a stock is doing. Volume can sometimes help explain what may be developing underneath the move.
In Stock Trading & Investing Using Volume Price Analysis, Anna Coulling explores how changes in trading volume can be analyzed alongside price action to identify accumulation, distribution, breakouts, and shifts in market participation.
Why Exchange Volume Statistics Matter
For traders and investors, exchange volume statistics provide valuable insight into market behavior.
High trading volume can indicate:
- Strong investor interest in a stock
- Greater liquidity and tighter spreads
- Confirmation of price trends
Conversely, low trading volume may signal weak market participation or uncertainty.
Technical traders often combine volume analysis with price movements to confirm breakouts, reversals, and momentum shifts.
For example, a price breakout accompanied by unusually high trading volume is generally considered more reliable than a move that occurs on low volume.
Because of this, exchange volume statistics remain one of the most widely used indicators in both technical and quantitative trading strategies.
Key Takeaways
U.S. markets continue to dominate global equity trading, and modern stock trading volume highlights the scale and complexity of today’s financial markets.
Key statistics include:
- U.S. equity markets process 10–12 billion shares per day on average
- NASDAQ accounts for roughly half of total share volume
- Off-exchange trading represents about 40–45% of activity
- Algorithmic trading drives 60–75% of total volume
As technology, regulation, and investor behavior continue to evolve, exchange volume statistics will remain a critical indicator for understanding liquidity, volatility, and overall market health.


If you want to go deeper:
- Explore the Trading Statistics Hub to understand how different sectors behave across market cycles
- Study real setups inside the Trade Reviews section
- Learn the framework behind high-probability setups in the Post-Earnings Momentum Strategy
This is how you turn raw market data into repeatable trading edge.
More Trading Statistics…


FAQ Section – Exchange Volume Statistics
What are exchange volume statistics?
Exchange volume statistics measure the amount of trading activity occurring across a stock exchange or financial market during a specific period. For stocks, volume is typically measured by the number of shares traded.
Traders and investors use exchange volume statistics to evaluate market participation, liquidity, volatility, and overall trading activity. Higher volume generally indicates greater participation, while unusually low volume can suggest reduced investor interest or weaker market activity.
What is the average daily trading volume in the U.S. stock market?
U.S. equity markets commonly process approximately 10–12 billion shares per day across exchanges and other trading venues. However, daily volume can vary substantially depending on market conditions.
During highly volatile periods, major economic announcements, earnings seasons, or periods of market stress, total U.S. trading volume can rise above 20 billion shares per day. On exceptionally active sessions, volume can climb even higher.
What does average daily trading volume mean?
Average daily trading volume, commonly abbreviated as ADV, represents the average number of shares traded during a specified period.
For example, if a stock traded 1 million, 1.5 million, 2 million, 1.2 million, and 1.3 million shares over five trading days, its five-day average trading volume would be 1.4 million shares per day.
Traders commonly compare current volume with a stock’s recent average to determine whether trading activity is unusually high or low.
Which U.S. exchange has the highest trading volume?
NASDAQ frequently accounts for a large portion of U.S. equity trading activity and can represent approximately 45–50% of share volume, depending on how exchange and market-wide activity are measured.
The New York Stock Exchange (NYSE) also handles enormous amounts of trading activity and is home to many of the world’s largest publicly traded companies.
However, modern U.S. equity trading is highly fragmented. A significant amount of trading also occurs through other exchanges, alternative trading systems, market makers, and off-exchange venues.
How many shares are traded in the U.S. stock market each day?
Approximately 10–12 billion shares can trade during a typical U.S. market session, although the number fluctuates considerably.
During periods of elevated volatility, trading volume can exceed 20 billion shares in a single session. Major market events can generate even larger spikes as institutions, algorithmic trading systems, and individual investors reposition their portfolios.
How much money is traded in the U.S. stock market each day?
The dollar value of U.S. equity trading can reach hundreds of billions of dollars per day and may exceed $500 billion during highly active periods.
Dollar volume differs from share volume because it considers both the number of shares traded and their prices. Trading 10 million shares of a $5 stock, for example, represents significantly less dollar volume than trading 10 million shares of a $200 stock.
What is the difference between share volume and dollar volume?
Share volume measures the number of shares that change hands during a specific period.
Dollar volume measures the approximate monetary value of those transactions by multiplying trading volume by the stock’s price.
For example, a stock trading 5 million shares at approximately $20 per share would generate roughly $100 million in dollar volume.
Dollar volume can sometimes provide better context when comparing trading activity between stocks with dramatically different share prices.
Why is trading volume important?
Trading volume helps traders measure the level of participation behind a price movement.
High volume can indicate:
- Strong investor participation
- Increased liquidity
- Greater institutional activity
- Increased market attention
- Stronger conviction behind a price move
- Potential confirmation of a breakout or trend
Low volume, by comparison, may suggest weaker participation or reduced conviction behind a price move.
Volume should generally be analyzed alongside price action rather than used as a standalone indicator.
Can high trading volume cause a stock price to rise?
High volume by itself does not necessarily cause a stock price to increase. Every completed transaction contains both a buyer and a seller.
What matters is the imbalance between buying and selling pressure and the prices at which market participants are willing to execute transactions.
Strong demand combined with rapidly increasing volume can accompany substantial price appreciation. Conversely, extremely high volume can also occur during sharp selloffs when investors are aggressively exiting positions.
Can trading volume increase before a stock price rises?
Yes. In some situations, increasing trading volume can appear before or during a significant price move.
Traders sometimes look for expanding volume as evidence that market participation is increasing before a breakout. For example, a stock consolidating near resistance while trading volume gradually increases may indicate that more traders are becoming interested in the stock.
However, increasing volume does not guarantee future price appreciation. Volume should be evaluated alongside price structure, catalysts, trend direction, volatility, and other market conditions.
What does unusually high trading volume mean?
Unusually high trading volume means significantly more shares are changing hands than would normally be expected based on a stock’s historical average.
For example, if a stock normally trades 500,000 shares per day but suddenly trades 5 million shares, its trading activity has increased by approximately 10 times its normal level.
Possible reasons include:
- Earnings announcements
- Analyst upgrades or downgrades
- Company guidance
- Mergers or acquisitions
- Regulatory announcements
- Clinical trial results
- Economic news
- Institutional buying or selling
- Short squeezes
- Technical breakouts
Unusually high volume often attracts traders because it can create greater liquidity, volatility, and price movement.
What is relative volume?
Relative volume, often called RVOL, compares a stock’s current trading volume with its normal or average volume.
A relative volume reading of 2.0, for example, generally means the stock is trading at approximately twice its usual volume for the comparable period.
Momentum traders frequently monitor relative volume because unusually elevated activity can indicate that a stock is receiving significantly more attention than normal.
Does higher trading volume mean higher liquidity?
Generally, yes. Stocks with consistently high trading volume tend to have greater liquidity because there are more buyers and sellers actively participating in the market.
Greater liquidity can contribute to:
- Tighter bid-ask spreads
- Faster order execution
- Reduced slippage
- Easier entry and exit from positions
However, liquidity also depends on order-book depth, market conditions, volatility, and the size of the order being executed.
Why does trading volume increase during market volatility?
Trading volume frequently rises during volatile markets because investors are rapidly adjusting their positions in response to changing information.
Economic reports, interest-rate decisions, geopolitical events, earnings announcements, and major market declines can cause institutions and retail investors to buy or sell more aggressively.
Algorithmic trading systems can further amplify this activity by automatically responding to changes in volatility, price, liquidity, or other market signals.
During severe market stress, total U.S. share volume can rise dramatically above normal levels.
How much stock trading occurs off-exchange?
A substantial portion of U.S. equity trading now occurs away from traditional public exchanges.
Recent market structure data has shown that approximately 40–45% of U.S. equity volume can occur off-exchange, although the percentage fluctuates.
Off-exchange activity can include trades executed through:
- Alternative trading systems
- Dark pools
- Wholesale market makers
- Broker internalization systems
These venues allow investors and institutions to execute trades without necessarily sending every transaction directly to exchanges such as the NYSE or NASDAQ.
What is a dark pool?
A dark pool is a private trading venue where investors, particularly large institutions, can execute transactions without publicly displaying their orders before execution.
Dark pools can help institutions trade large blocks of stock without immediately revealing their intentions to the broader market.
However, critics argue that large amounts of off-exchange trading can reduce transparency and fragment liquidity across multiple trading venues.
What percentage of stock market volume is algorithmic trading?
Algorithmic trading is estimated to account for approximately 60–75% of U.S. equity trading volume, although estimates vary depending on how algorithmic trading is defined and measured.
Algorithms are commonly used for:
- Market making
- Arbitrage
- Institutional order execution
- High-frequency trading
- Statistical strategies
- Portfolio rebalancing
Because automated systems can submit and execute orders extremely quickly, algorithmic trading has become a major component of modern market activity.
What is the relationship between trading volume and volatility?
Volume and volatility often increase together, particularly when major information enters the market.
A significant news event can cause thousands of market participants to reassess the value of a stock simultaneously. This can increase both the number of shares traded and the size of price movements.
However, high volume does not always mean extreme volatility. Highly liquid stocks can trade enormous numbers of shares while experiencing relatively small percentage price changes.
Does high volume confirm a breakout?
Many technical traders view a breakout accompanied by elevated volume as stronger than a breakout occurring on unusually low volume.
Higher volume can indicate that more market participants are participating in the move, potentially increasing confidence that the breakout reflects genuine demand.
For example, if a stock breaks above an important resistance level while trading several times its normal volume, traders may consider the move more significant than the same breakout occurring during extremely light trading.
However, even high-volume breakouts can fail, which is why volume should be used alongside other technical and fundamental information.
Is low trading volume bad?
Low trading volume is not necessarily bad, but it can create additional challenges for traders.
Thinly traded stocks may experience:
- Wider bid-ask spreads
- Greater slippage
- Reduced liquidity
- More erratic price movements
- Greater difficulty entering or exiting large positions
For active traders, sufficient liquidity is particularly important because entering and exiting positions quickly can significantly affect trading performance.
What causes stock market trading volume to increase?
Trading volume can increase for many reasons, including:
- Corporate earnings reports
- Economic announcements
- Federal Reserve decisions
- Major company news
- Analyst ratings changes
- Mergers and acquisitions
- Index additions or removals
- Options expiration
- Institutional portfolio rebalancing
- Increased retail investor activity
- Market crashes or corrections
Stocks experiencing major catalysts can sometimes trade several times their normal average volume.
When is stock market trading volume typically highest?
Trading activity is often greatest near the market open and market close.
The opening period reflects orders accumulated overnight as investors react to earnings announcements, economic reports, international market movements, and company news.
Volume often increases again near the closing bell as institutional investors, funds, and algorithmic systems complete orders and rebalance portfolios.
The middle of the trading session is frequently quieter by comparison.
How do traders use volume when analyzing stocks?
Traders can use volume in several ways.
They may look for:
- Volume expansion during breakouts
- Declining volume during consolidation
- Unusual relative volume
- Volume spikes following catalysts
- Increasing volume during established trends
- Extremely high volume near potential reversals
- Differences between price direction and volume activity
Volume analysis helps traders determine how much market participation exists behind a particular price movement.
Is trading volume a leading or lagging indicator?
Volume can function as a confirming indicator, although some traders also use changes in volume to look for signs that market participation is shifting before a significant price movement occurs.
For example, steadily increasing volume during a consolidation may attract attention before a breakout develops.
Volume does not reliably predict future prices on its own, however. It provides additional information about participation and trading activity that traders can combine with price action, catalysts, technical levels, and broader market conditions.
Where can investors find stock exchange volume statistics?
Exchange and market volume statistics are available from several sources, including:
- Securities Industry and Financial Markets Association (SIFMA)
- NASDAQ
- New York Stock Exchange
- FINRA
- Brokerage trading platforms
- Financial market data providers
Individual stock volume is also displayed on most financial websites, charting platforms, and brokerage applications.
What is the most important thing to understand about trading volume?
The most important concept is that volume measures participation, not direction.
A surge in trading volume tells investors that significantly more market activity is occurring, but volume alone does not tell them whether a stock will rise or fall.
The most useful insights generally come from analyzing volume together with price action. Increasing volume alongside a breakout, earnings catalyst, or sustained trend can provide substantially more context than either price or volume analyzed independently.
Sources and References
Financial Industry Regulatory Authority. (2025). Off-exchange trading statistics and ATS volume data. https://www.finra.org
JPMorgan Chase & Co. (2024). Guide to the Markets: Global equity market structure and trading trends. https://www.jpmorgan.com
New York Stock Exchange. (2025). NYSE market statistics and trading volume reports. https://www.nyse.com/market-data
NASDAQ. (2025). NASDAQ trading statistics and market activity reports. https://www.nasdaq.com/market-activity
Securities Industry and Financial Markets Association. (2024). Equity market structure report. https://www.sifma.org
TABB Group. (2024). Global electronic trading and market structure study. https://www.tabbresearch.com


Leave a Reply