

In this EAT case study, you’ll learn how Brinker International’s strong earnings and bullish technical analysis produced a +13.79% maximum favorable excursion (MFE) and +8.65% end-of-day return, despite failing all three technical breakout confirmations. We’ll examine the fundamentals, initial +5.43% earnings candle, and why an imperfect post-earnings momentum setup still delivered.

Not every successful post-earnings momentum trade requires a perfect technical setup.
Sometimes, strong earnings, a positive initial market reaction, and continued buying pressure are enough to produce a meaningful opportunity.
Brinker International (NYSE: EAT) provided an example following its October 28, 2026, earnings release. Despite failing to produce breakouts across multiple timeframes, EAT delivered a +13.79% maximum favorable excursion (MFE) and an +8.65% end-of-day (EOD) return.
Brinker International operates the Chili’s Grill & Bar and Maggiano’s Little Italy restaurant chains. The company belongs to the Consumer Discretionary sector, operates in the restaurant industry, and had an estimated market capitalization of $9.24 billion at the time of this study.
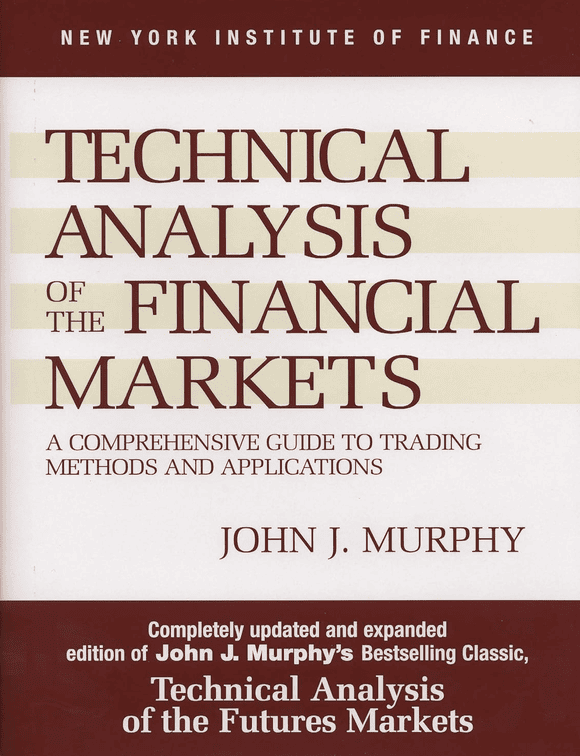
Learn the Fundamentals of Technical Analysis
John J. Murphy’s Technical Analysis of the Financial Markets covers charts, trends, indicators, candlesticks, intermarket relationships, and other core technical analysis concepts.
Price: $34.27–$35.50
View on Amazon →EAT Fundamentals and Earnings Results
Brinker International reported its fiscal Q1 2027 earnings on October 28, 2026, before the market opened. The results exceeded Wall Street expectations, supported by improving restaurant margins, strong Chili’s sales, and increased full-year guidance.
Brinker International: Earnings Highlights
Strong earnings growth, positive surprises, and rising restaurant sales.
Importantly, profitability improved alongside revenue growth.
Brinker’s non-GAAP restaurant operating margin increased to 17.7% from 16.2% a year earlier, representing a 150-basis-point improvement. Its GAAP operating margin also expanded from 8.7% to 10.2%.
These improvements suggested that Brinker was benefiting from stronger restaurant sales and operating leverage rather than simply generating additional revenue at the expense of profitability.
Lastly, management also increased its full-year fiscal 2027 outlook.
Revenue guidance was raised to $6.23–$6.33 billion, compared with the previous range of $6.15–$6.27 billion. The midpoint increased approximately 1.1%.
Adjusted EPS guidance increased to $13.30–$13.90, compared with the previous range of $12.60–$13.40, representing a midpoint increase of approximately 4.6%.
Although the updated revenue outlook remained broadly aligned with analyst expectations, the combination of earnings beats, expanding margins, and higher guidance provided a fundamentally positive backdrop.
For a post-earnings momentum trader, the important takeaway was straightforward: the company’s financial results supported the bullish market reaction.

Explore options trading and hedging strategies for managing bullish and bearish market exposure.
View on Amazon →EAT Technical Analysis & Post-Earnings Momentum Setup
Following its earnings announcement, Brinker International generated a bullish first-hour earnings candle, establishing the initial conditions for a potential post-earnings momentum trade.
However, the setup was not without weaknesses.

Initial Earnings Candle and Technical Conditions
The first-hour candle gained +5.43%, exceeding the 5% minimum movement threshold used in our post-earnings momentum strategy.
Several technical characteristics stood out:
Post-Earnings Momentum Setup
Strong initial buying pressure, but no confirmed multi-timeframe breakouts.
The first-hour candle wasn’t particularly encouraging, but still provided several clues that this was a strong PEM setup.
Its minimal wick retracement suggested that buyers maintained control throughout much of the initial reaction, with little evidence of a significant intrahour reversal.
However, EAT failed to confirm a breakout on the hourly, four-hour, or daily timeframes.
While this wasn’t a clean setup, we’ve often noted setups that don’t fully breakout on the 1-hour earnings reaction. Instead, what happens sometimes is that the candle makes an initial momentum move and then proceeds to breakout during the trading session.
Consequently, EAT was not a textbook technical setup. Nevertheless, the initial price reaction, favorable candle structure, and strong fundamentals made it a worthwhile candidate for analysis.
EAT Post-Earnings Momentum Outcome
Despite its lack of confirmed technical breakouts, EAT delivered a strong continuation during the following trading session.
Measured from the close of the initial one-hour earnings candle, the stock produced the following results:
EAT Momentum Trade Results
Measured from the close of the initial hourly earnings candle.
The most notable characteristic was the relatively small adverse excursion. EAT moved just 0.89% against the hypothetical entry before achieving a maximum favorable excursion of 13.79%.
Furthermore, the stock reached a +9% profit threshold without first experiencing a −5% drawdown.
Alternatively, entering at the close of the hourly earnings candle and exiting at the following regular-session close, EAT would have generated an +8.65% return.
The outcome demonstrates that while multi-timeframe breakouts can help identify promising setups, their absence does not automatically prevent a stock from producing strong post-earnings continuation.
Learn the Fundamentals of Technical Analysis
John J. Murphy’s Technical Analysis of the Financial Markets covers charts, trends, indicators, candlesticks, intermarket relationships, and other core technical analysis concepts.
Price: $34.27–$35.50
View on Amazon →Conclusion: Not Perfect, but Profitable
The EAT case study highlights a straightforward example of post-earnings momentum working despite an imperfect technical setup.
Brinker International delivered strong earnings, improving margins, and increased guidance. Its initial +5.43% earnings candle showed limited selling pressure, although the stock failed to establish confirmed breakouts across the three timeframes examined.
Nevertheless, EAT ultimately delivered a +13.79% MFE, just −0.89% MAE, and an +8.65% EOD return.
The takeaway is simple: a setup doesn’t necessarily need every technical variable to align to produce a meaningful post-earnings momentum opportunity. Strong fundamentals, a convincing initial reaction, and sustained buying pressure can sometimes be enough.
EAT was not a perfect setup. But it delivered.
Explore options trading and hedging strategies for managing bullish and bearish market exposure.
View on Amazon →If you want to go deeper:
- Explore the Trading Statistics Hub to understand how different sectors behave across market cycles
- Study real setups inside the Trade Reviews section
- Learn the framework behind high-probability setups in the Post-Earnings Momentum Strategy
This is how you turn raw market data into repeatable trading edge.


Leave a Reply